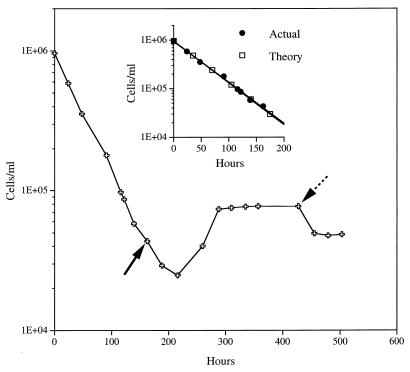
FIG. 2.
Direct cell counts for a deep-sea NSW sample grown at 450 × 105 Pa and 3°C at a dilution rate of 0.028 h−1 (retention time, 35 h) before and after the introduction at 160 h (solid arrow) of 10 mg of glucose per liter to the seawater reservoir. Growth under these conditions was continued until 427 h (dotted arrow), and then the chemostat was decompressed to 105 Pa with the flow continuing at the same dilution rate. (Inset) Exponential curve fit for cell numbers at the actual and theoretical washout rates in NSW that was not supplemented.

