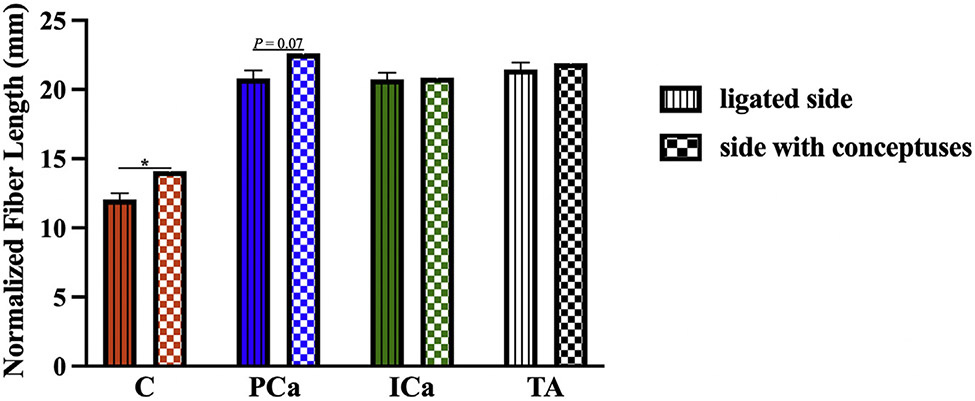
FIGURE 3. Comparison of PFM normalized fiber lengths between the sides with vs without conceptuses.
The data are presented as mean±standard error of mean. Some standard errors of mean values were too small to be visible as error bars. Single asterisk represents P<.05 derived from paired Student t test.
C, coccygeus; ICa, iliocaudalis; PCa, pubocaudalis; TA, tibialis anterior.

