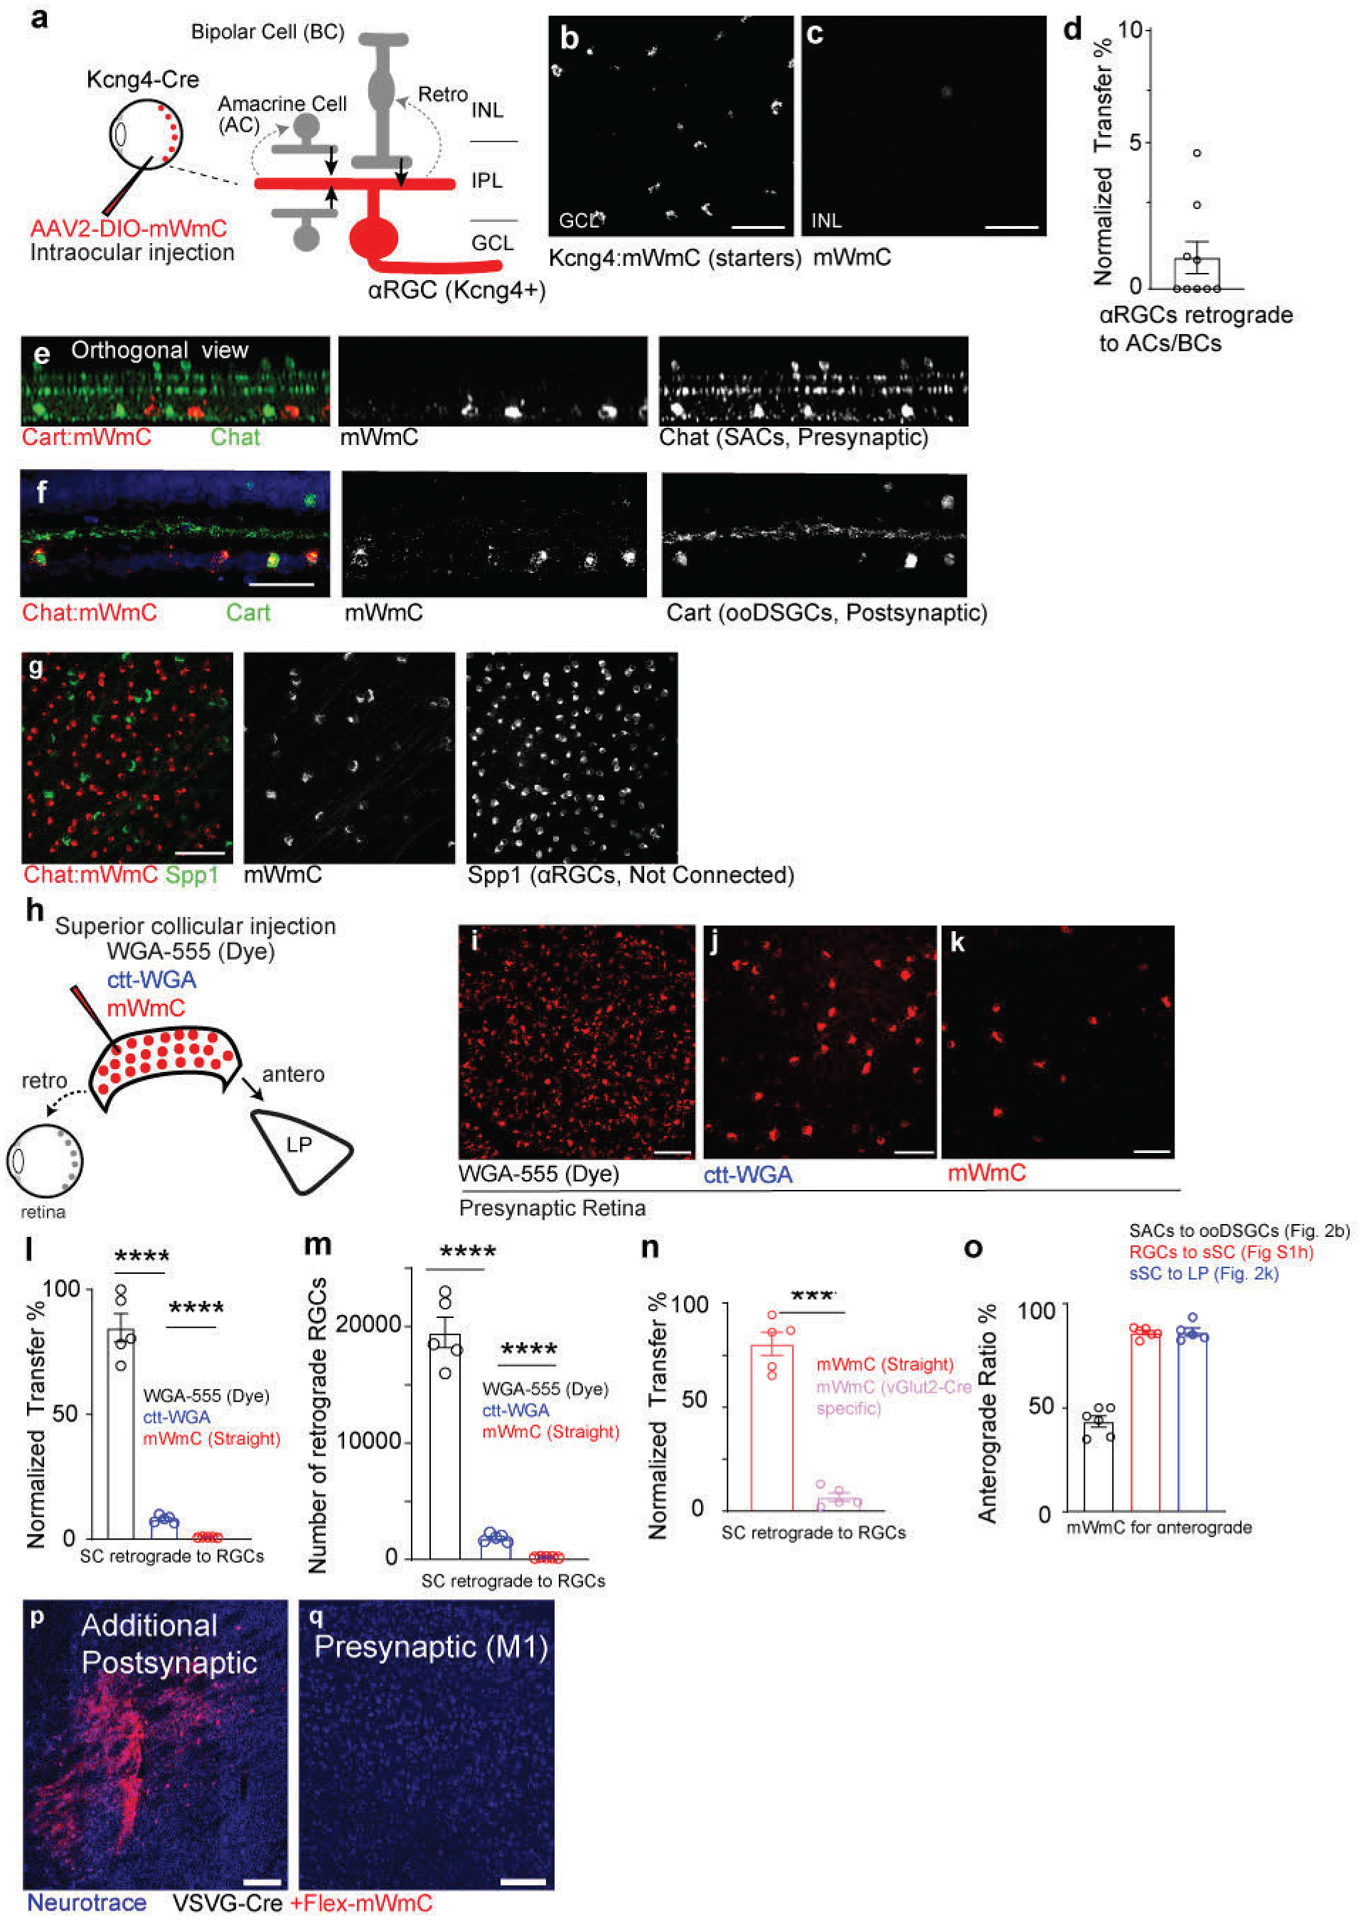
Extended Data Fig. 2. Comparison of different versions of WGA tracer for their anterograde and retrograde transfer capacities in the retinotectal synapses.

a-d, a, a schematic drawing of the injection within the retinal circuit. b, Retinal wholemount view to show mWmC coverage from RGC starter neurons (Kcng4-Cre for αRGC subclass neurons) in the ganglion cell layer (GCL, b), with limited retrograde transfer to the inner plexiform layer (INL, c). Scale bar: 50μm, with the retrograde transfer ratios quantified in (d). n=9 biologically independent samples. e-g, Orthogonal view (e) of RGC labeling with mWmC (red) without any retrograde transfer onto SACs (green, Chat). Intraocular injections of mWmC into Chat-Cre led to labeling of SACs (red) for anterograde and monosynaptic tracing onto ooDSGCs (Cart-positive, green; mWmC, red double-positive) in (f). Scale bar: 50μm (e, f). Additionally, Chat-mWmC labeling does not lead transfer mWmC to SPP1-positive neurons (αRGCs, g), indicating the specificity of anterograde transsynaptic transfer as opposed to trans-cellular transfer within a local area. Scale bar: 50μm(g) 0% Spp1-positive, n=4 animals. h, Injections of WGA-protein conjugated dye, AAV-expressing ctt-WGA cDNA, and AAV-expressing mWmC into SC lead to efficient anterograde transfer to LP. However, they displayed different levels of retrograde labeling, including bright axonal uptake and faint retrograde transfer. mWmC (j) displayed with very limited retrograde spread onto the retina. This is a significant improvement in limiting retrograde transfer compared to WGA-Alexa555 dye (i) or AAV-expressing ctt-WGA (k). n=4 animals in each condition. Scale bars: (i, j, k, 50 μm). l, Retrograde transfer ratios were normalized across three configurations of the WGA, using the highest numbers from WGA-555 as 100%. n=5 biologically independent samples. ****, p<0.0001, two-sided Student’s t-test. m, Average numbers of retinal ganglion cells per retina were quantified and compared across the three conditions. n=5 biologically independent samples. ****, p<0.0001, two-sided Student’s t-test. n. Additionally, restricting the starter neurons genetically in SC vGlut2-Cre cells further eliminated the axonal retrograde uptake (compared to global mWmC expression). n=5 biologically independent samples. ****, p<0.0001, two-sided Student’s t-test. o, Retrograde transfer ratios were normalized across two conditions, using the highest numbers from straight mWmC expression as 100%. n=5 biologically independent samples. ****, p<0.0001, two-sided Student’s t-test. p, GPe, another downstream target of the striatum injection (Fig. 2m, n) was traced here; q, Magnified view of M1 in Fig. 3n from the striatum retrograde tracing showed no retrograde spread from the Striatum. Scale bar p-q, 100μm. All data in this figure are presented as mean ± SEM.
