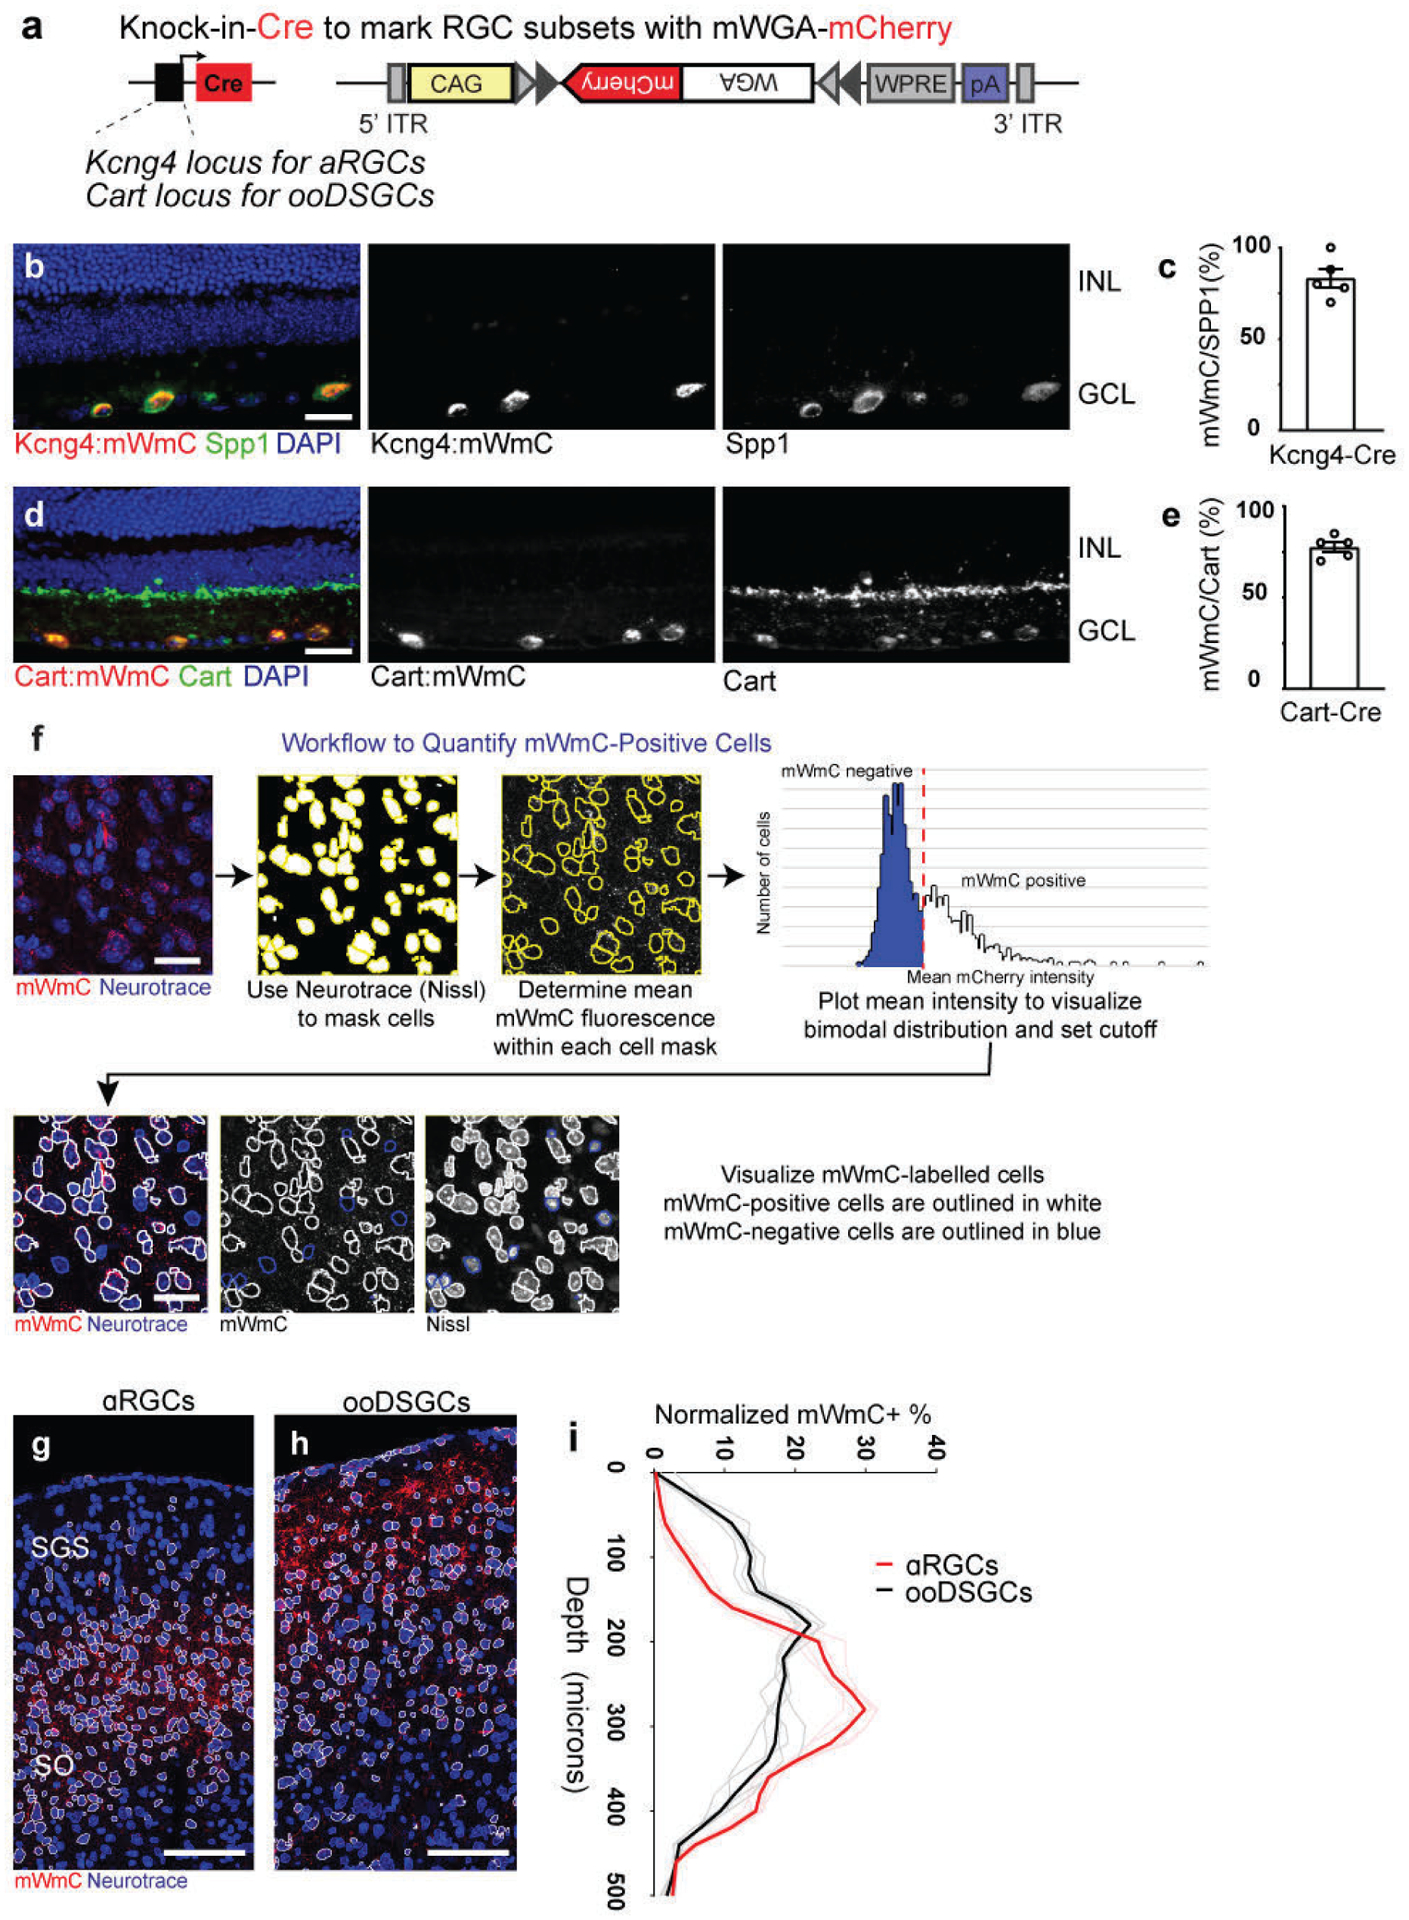
Extended Data Fig. 7. Cre-dependent mMmC for RGC type-specific circuit mapping.

a, Genetic design of AAV vector for Cre-dependent mWmC (AAV2-CAG-DIO-mWmC-WPRE) expression to achieve neuronal subtype-specific anterograde transsynaptic tracing. b-e, mWmC infection can achieve efficient and restricted expression in RGC starter neuron subclasses: Kcng4-Cre is a driver for αRGC subtypes (Spp1-positive, b); and Cart-Cre is a driver for all ooDSGC subtypes (Cart-positive, d). Notably, these Cre-dependent mWmC expressions are restricted to the starter neurons without retrograde spread into the inner retina (i.e., no bipolar cells and amacrine cells uptake mWmC), scale bars: 20μm. The specificities of the Cre-drivers were quantified in c (Kcng4-Cre) and e (Cart-Cre), respectively. n=5 animals, per genotype. Data in this figure are presented as mean ± SEM. f, mWmC demonstrated a bimodal distribution of red fluorescence in recipient neurons. Thresholding for the high fluorescence intensity population allowed neurons across tissue slices to be classified as transferred or un-transferred. g-i, RGC-subclass specific mWmC anterograde transfer properties can be quantified in the postsynaptic neurons. Anterograde transsynaptic tracing from different starter retinal ganglion cell (RGC) types was compared (g, αRGCs; h, ooDSGCs as Fig. 6) and quantified using this workflow. This quantification (i) demonstrated the differential distribution of SC neurons receiving mWmC transfer from RGC starter cells, supporting the electrophysiology and genetic data from Fig. 5. n=5 animals, per genotype Scale bar: 100μm. (Black line is mean intensity curve, gray lines are each example. Red line is mean intensity curve, light red lines are each example).
