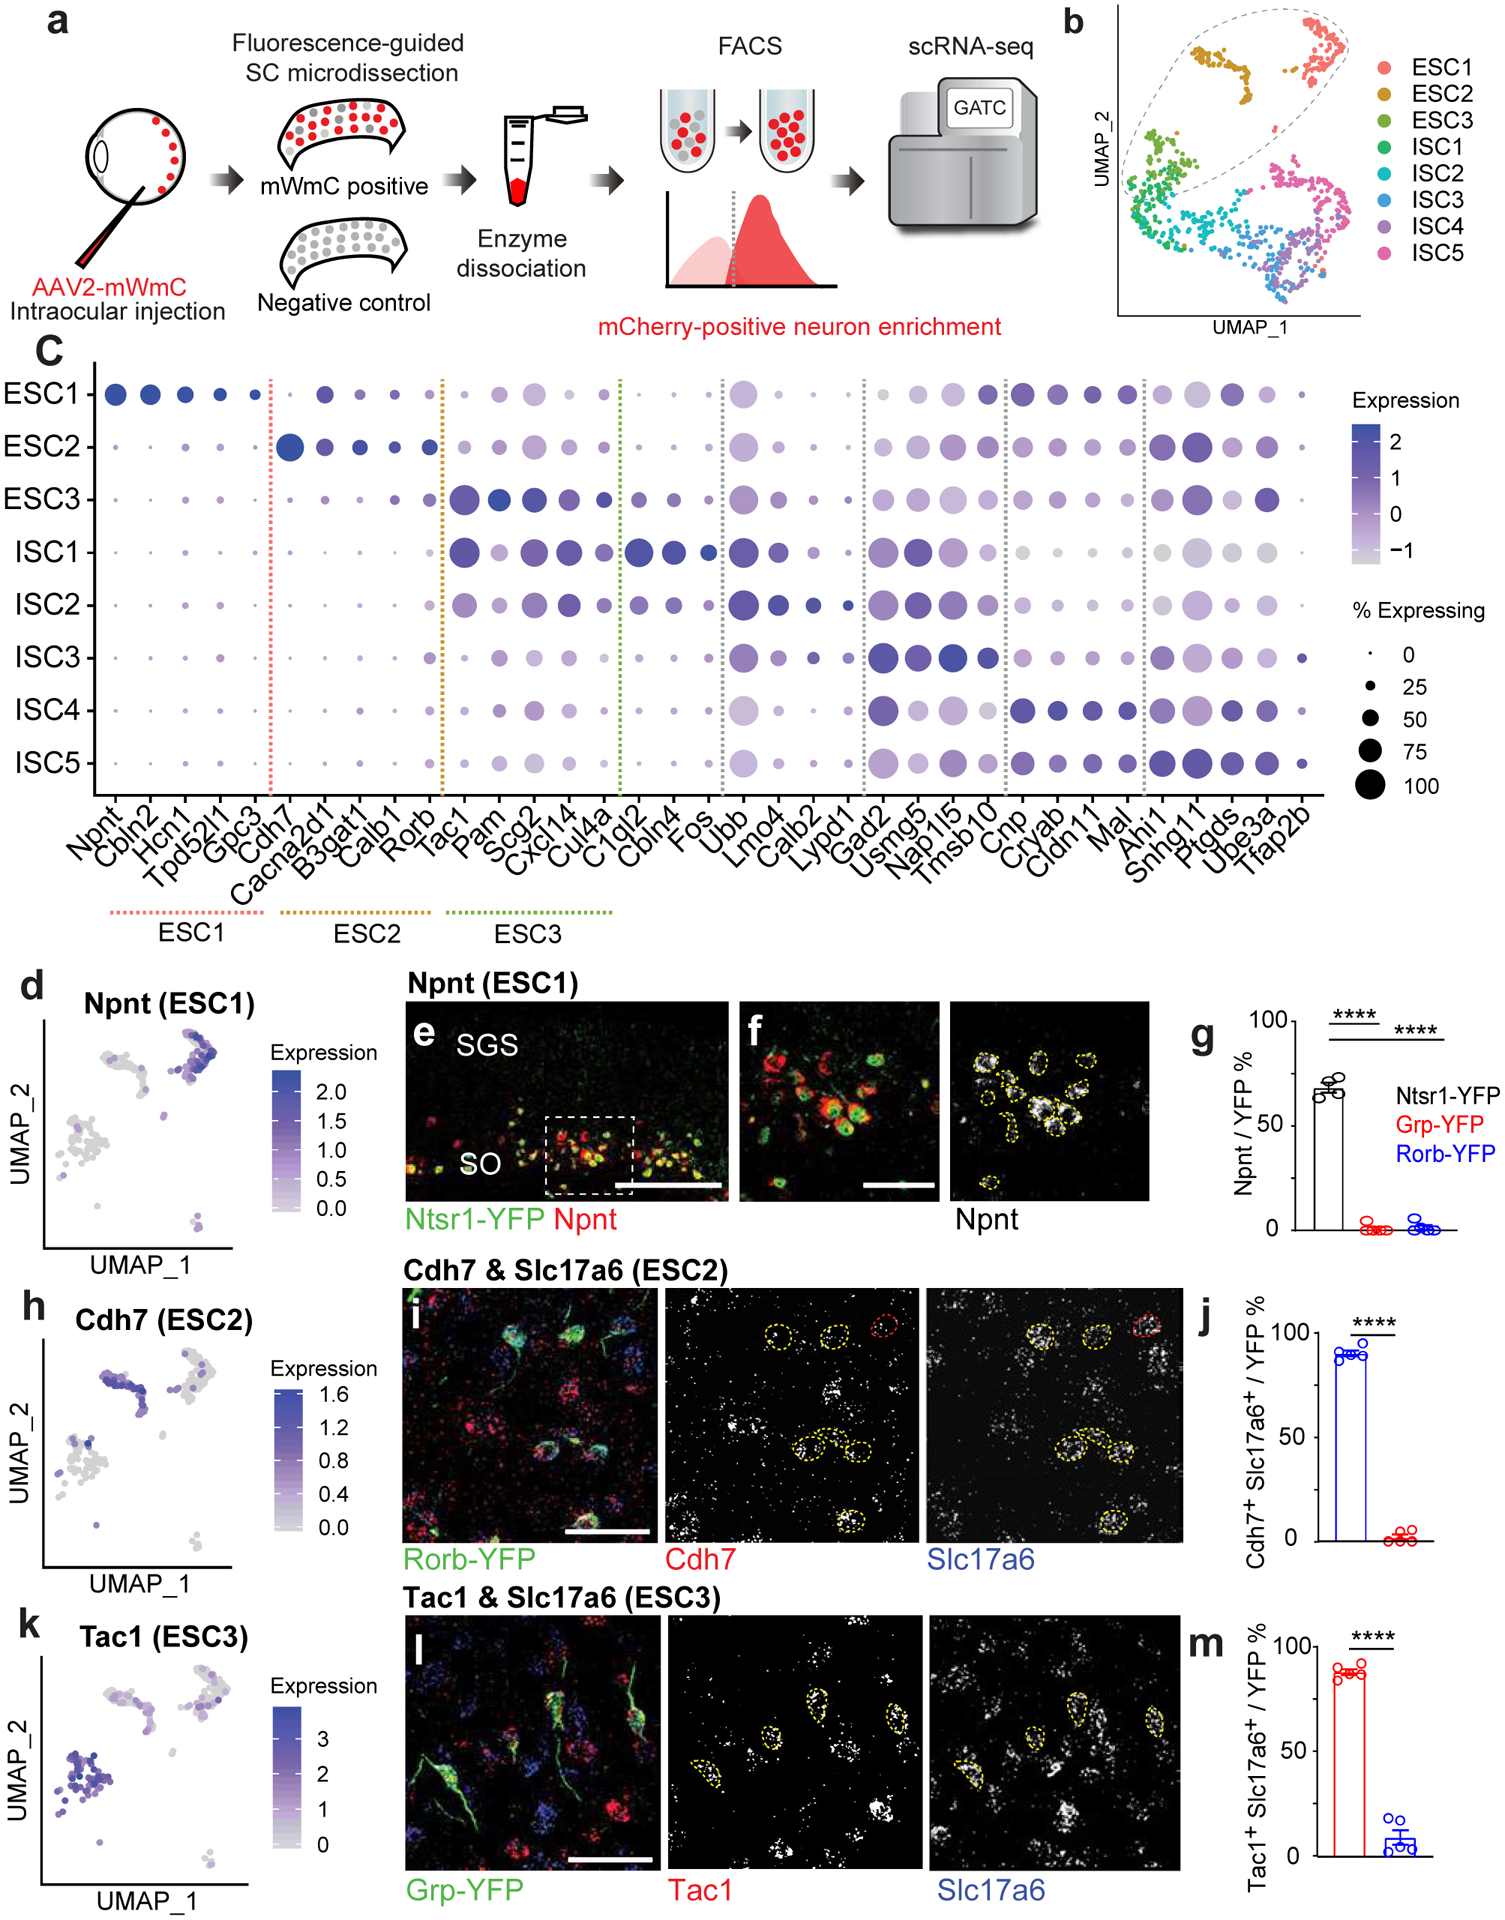
Fig. 5. Trans-Seq integrates mWGA-mCherry-mediated anterograde transsynaptic tracing and scRNA-Seq to categorize the RGC connected neurons in the SC.

a, To generate a molecular atlas for all RGC-connected SC neurons, the following workflow was used to dissociate the SC and isolate mCherry-positive recipient neurons by FACS. The workflow starts with the injection of mWmC into the left retinas of mice, followed by right SC slicing, fluorescence-based microdissection, enzyme dissociation, and FACS for red fluorescence from mWmC. The scRNA-Seq library preparation and subsequent data analysis using the standard 10XGenomics platform and Seurat Packages. b, scRNA-Seq libraries were generated using the 10XGenomics platform. From three replicates, we recovered scRNA-Seq data from 898 adult SC recipient neurons, identified through neuronal markers, thereby generating a molecularly defined connectivity map from pan-RGC anterograde tracing. UMAP plots of the Trans-Seq data from all RGCs (Pan-RGC) show three excitatory neuron clusters (ESCs) and five inhibitory neuron clusters (ISCs). Among all retinorecipient SC neurons subtypes, there were 307 excitatory neurons (within the dotted circle) and 591 inhibitory neurons. c, Dot plot of top marker genes. ESC1-ESC3 are represented on the left of the plot for top feature genes, while ISC1–5 are represented on the right of the plot for top feature genes. (d, h, k) UMAP plots for primary marker genes for each ESC, d, Npnt for ESC1, h, Cdh7 for ESC2, and k, Tac1 for ESC3. e, f, Validation of Trans-Seq marker gene expression from ESC1 using RNA-Scope in situ hybridization. e, Npnt (red) is enriched in Ntsr1-GN209-YFP (green) transgenic for wide-field excitatory neurons as quantified in g. f, Higher magnification of boxed area highlighted in e. n=4 animals, Scale bars: (e, 250μm; f, 50μm). i, Validation of Trans-Seq marker gene expression from ESC2 using RNA-Scope in situ hybridization. Cdh7 (red) and Slc17a6 (blue) double-positive neurons are enriched in the Rorb-YFP line primarily for SC stellate cells as quantified in j, n=5 animals. l, Validation of Trans-Seq marker gene expression from ESC3 using RNA-Scope in situ hybridization. Tac1 (red) and Slc17a6 (blue) double-positive neurons are enriched in the Grp-KH288-YFP transgenic line for narrow-field excitatory neurons as quantified in m. n=5 animals, Scale bars: (i, l, 50μm). Dotted yellow circles (f, i, l) indicate overlapped in situ signals with GFP staining, and red circles in i indicate in situ signals non-overlapping with GFP staining. Quantification plots ****, p<0.0001, two-sided Student’s t-test. (g, j, m). All data in this figure are presented as mean ± SEM.
