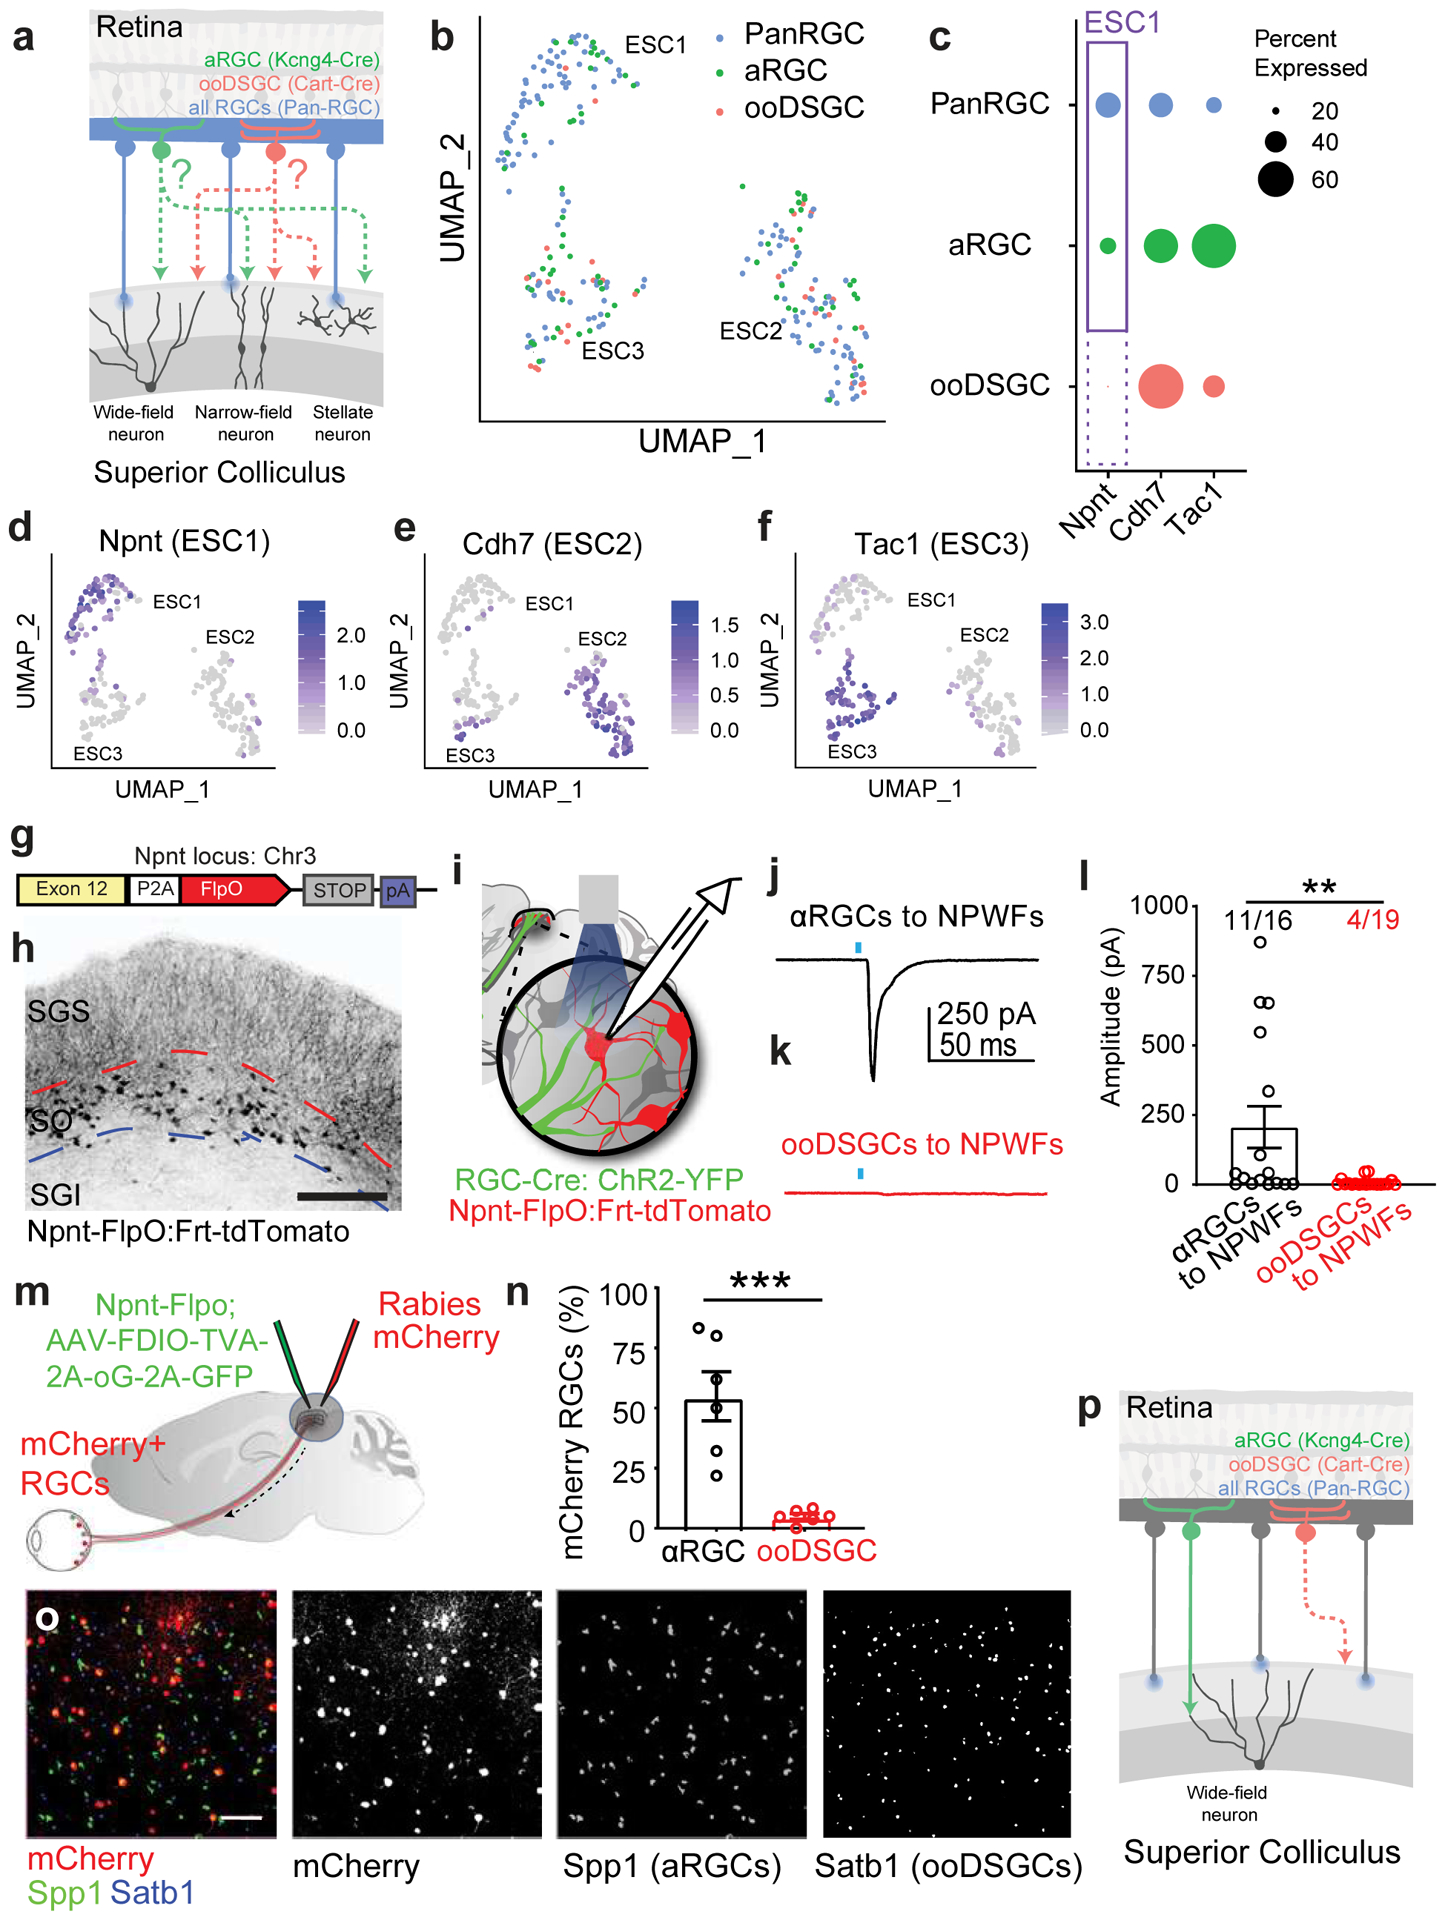
Fig. 7. Comparative analysis of the Trans-Seq data predicted a selective synapse from αRGCs, but not ooDSGCs to Npnt-positive Wide-field neurons (NPWFs), confirmed experimentally.

a, Schematic drawing for a comparative Trans-Seq between the downstream SC neuron types of αRGCs (green) and ooDSGCs (red), in addition to the existing pan-RGC (blue). Tracing dataset, with three replicates for each. The goal is to identify selective retinotectal circuits from RGC types to SC neuron types. RGC subclass-specific Cre-drivers include Kcng4-Cre for αRGCs and Cart-Cre for ooDSGCs. b, UMAP plots generated after aligning the pan-RGC (blue), αRGC (green), and ooDSGC (red) tracing datasets and clustering 268 excitatory neurons into the three ESCs established in the pan-RGC mapping (Fig. 4). Notably, very few red dots from ooDSGC tracing are present in ESC1, indicating limited ooDSGCs innervation of ESC1s (NPWFs); By contrast, the αRGC tracing dataset (green) contain significant ESC1 [ESC1, 67 blue, 18 green, 2 red; ESC2, 62 blue, 29 green, 18 red; ESC3 32 blue, 25 green, 15 red). c, Dot-plot of three ESCs showing differential gene expression of validated marker genes among three different tracing datasets from pan-RGCs (blue), αRGCs (green), and ooDSGCs (red). Confirmed marker genes were established in Fig. 3, including Npnt for ESC1, Cdh7 for ESC2, and Tac1 for ESC3. The sizes of the dots encode the percentages of cells expressing each marker gene within each RGC tracing dataset. The presence of ESC1 (Npnt+) in αRGC tracing datasets (solid-line frame), but the absence of ESC1 (Npnt+) in ooDSGC tracing datasets (dotted-line frame), indicate that ESC1s receive selective inputs from αRGCs but not ooDSGCs. d-f, UMAP plots validating the same set of ESC markers in the combined tracing datasets of pan-RGCs, αRGCs, and ooDSGCs. d, Enriched Npnt expression in ESC1 (NPWF neurons), e, Cdh7 in ESC2, and f, Tac1 in ESC3. The normalized log expression of each gene is presented here. g, Design of Npnt-FlpO targeting vector to mark and manipulate Nephronectin-positive wide-field neurons (NPWFs) using the endogenous Npnt locus on mouse Chr3. h, Npnt-FlpO; Frt-Td-Tomato specifically labels ESC1 as a unique neuronal population in the SO but not in SGI. Scale bar: 250 μm. i, Schematic drawing of the binary genetic strategy to examine selective connectivity from specific RGC-subclasses (RGC-Cre; AAV-FLEX-ChR2-YFP, green) to NPWF neurons (Npnt-FlpO; Frt-TdTomato, red), using optogenetics-mediated electrophysiology. Kcng4-Cre; Npnt-Flp and Cart-Cre; Npnt-Flp crosses were compared. j, Average of five trials of evoked EPSCs recorded from one NPWF neuron, driven by ChR2-YFP expressed in αRGC (Kcng4-Cre; AAV-DIO-ChR2-YFP). The blue dot indicates the 2-ms blue LED stimulation, followed by a monosynaptic evoked current, n=7animals. k, Sample EPSC trace recorded from NPWF neurons, driven by ooDSGCs (Cart-Cre; AAV-DIO-ChR2-YFP), n=4animals. l, Average EPSC amplitudes were quantified. Percentages of connectivity were compared. Significantly higher ChR2-mediated synaptic currents onto Npnt-positive ESC1 neurons were detected from αRGCs (black). In contrast, very small currents can be detected in a few ooDSGCs (red), which can be further blocked by TTX (1μM) and 4-AP (100μM)(Extended Data Fig. 13c). **, p<0.001, two-sided Student’s t-test. m, Schematic drawing of Npnt-FlpO-dependent retrograde tracing from NPWFs to the retina at neuronal type resolution, using two viral components (Flp-dependent EGFP-2a-TVA-2a-oG, green; and RdGV-mCherry, red) that infect SC neurons in green and red, and retrogradely labeled RGCs in red only. n, Percentage of αRGCs (Spp1, black) and ooDSGCs (Satb1, red) RGCs among all mCherry-positive RGCs were quantified, n= 6 animals. ***, p<0.005, two-sided Student’s t-test. o, Retina wholemount images showing that retrogradely labeled RGCs (mCherry-positive, red) highly overlap with αRGCs (SPP1-positive, green), but not ooDSGCs (Satb1-positive, blue). Scale bar: 100 μm. p, Schematic drawing for the finding based on Trans-Seq prediction and experimental validations shows a selective retinotectal synapse from αRGCs (green), but not ooDSGCs (red) to NPWFs in the SC. All data in this figure are presented as mean ± SEM.
