
Fig. 8. Npnt instructs the selective retinotectal circuit wiring from αRGCs to NPWFs.
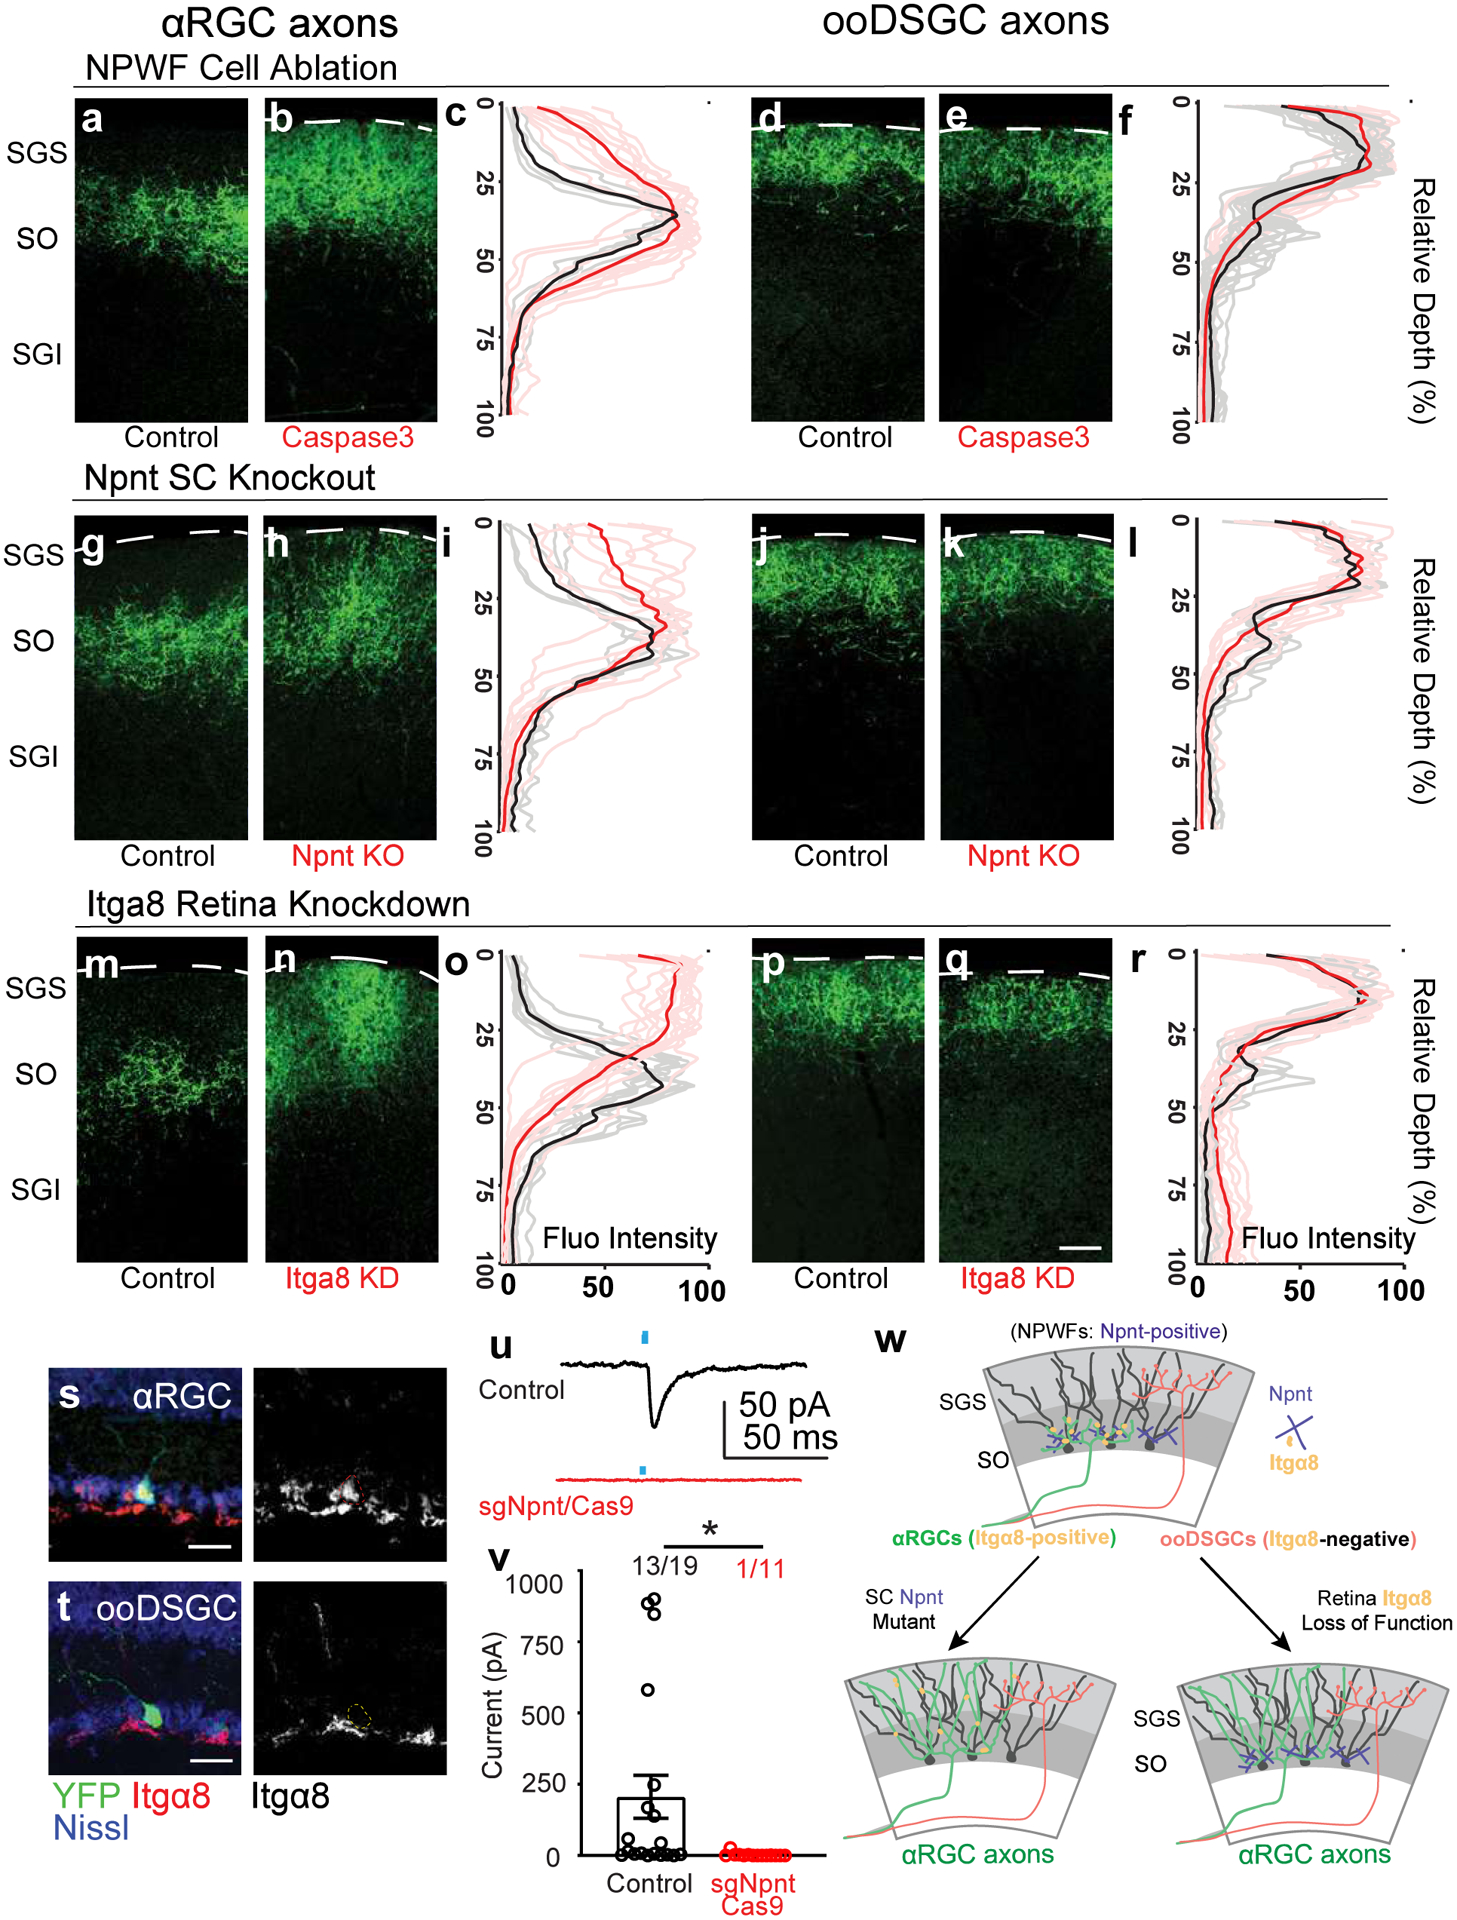
a, b, Sample images of αRGC axons (Kcng4-YFP) in the SC, subject to NPWF neuron elimination mediated by (Npnt-FlpO; AAV-FDIO-Caspase3-Tev) b and control a. c, Normalized GFP axon fluorescence intensity of line scans drawn perpendicular to the SC of control (black line is mean intensity curve, gray lines are each example) and after NPWF elimination (red line is mean intensity curve, light red lines are each example). The dotted line marks the pial surface. d, e, Sample images of ooDSGC axons in the SC, subject to NPWF neuron elimination mediated by (Npnt-FlpO; AAV-FDIO-Caspase3-Tev) e and control d. f, Quantification as in c for ooDSGC axons. (n >=20 axons per animal, n=4 animals, per genotype). g to l, Sample images of αRGC axons in the SC subject to SC-specific Npnt knockout mediated by AAV-Cre injection, leading to axonal sublamination deficits h and control g. i as in c, Quantification shows the ectopic sublaminar distribution of αRGC axons in the upper SC, phenocopying NPWF-elimination c. j, k, Sample images of ooDSGC axons in the SGS, subject to SC-specific Npnt knockout mediated by AAV-Cre injection, k and control j. l, Quantification as in c showing that ooDSGC axons are not perturbed subject to Npnt knockout. (n >=20 axons per animal, n=4 animals, per genotype). m to r, sgRNA/Cas9 targeting Itga8 was delivered at embryonic (E) day 14.5 through in utero intraocular injections. m, n, Sample images of αRGC axons in the SC, subject to retina-specific Itga8 knockout mediated by sgRNA-Itga8/Cas9, leading to axonal sublamination deficits n and control m. o, Quantification shows the ectopic sublaminar distribution of αRGC axons in the upper SGS, phenocopying Npnt mutants h. Sample images of ooDSGC axons in the SC, subject to retina-specific Itga8 knockout mediated by sgRNA-Itga8/Cas9 q and control p. r, Quantification shows that ooDSGC axons are not perturbed subject to Itga8 knockout. (n>=20 axons per animal, n=4 animals, per genotype). Scale bars: (a-q, 50 μm). s, t, Sample images show selectively enriched expression of Itga8 in αRGCs (s, 74.6±8.3%, n=5 animals) but very limited if any expression in ooDSGCs (t, 3.4±1.2%, N= 5 animals). Scale bar: 25 μm. u, v AAV-sgNpnt-FDIO-mCherry was injected into the right SC hemisphere (Kcng4-Cre; Npnt-FlpO; H11Cas9) mice, followed by injections of AAV-DIO-ChR2-YFP to induce ChR2-YFP expression in αRGC cells. Kcng4-Cre; Npnt-FlpO; H11Cas9 mice injected with a non-cutter sgRNA-mCherry construct in the SC served as controls. mCherry+ NPWFs were targeted for whole-cell patch-clamp recordings. u, Sample evoked ESPCs traces showing the loss of specific connectivity subject to Npnt-loss-of-function (red), compared to controls (black). Blue dots mark the onsets of blue-light stimulations. v, The average ESPC amplitudes and percent connectivity from αRGCs to NPWFs were assessed by ChR2 activation in αRGCs. Both amplitudes and percentages connectivity decrease after Npnt-knockout (red, n=8 animals), compared to controls (black, n=8 animals). *, p<0.05, two-sided Student’s t-test. w, Model summarizing how Npnt-Integrin interactions guide RGC axons and specify the specific retinotectal synapse. Npnt acts as an anchor for axons from α8 integrin-positive αRGCs to laminate within the lower SGS and forms synapses onto NPWFs. ooDSGCs, which do not express Itgα8, do not bind Npnt and do not synapse onto NPWFs. Data in this figure are presented as mean ± SEM.