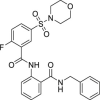
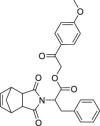
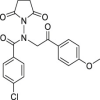
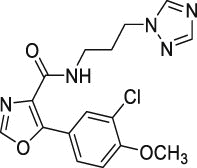
Table 1.
Biological profile of hit compounds
| Compound | VSa | Structure | Antiviral Activity EC50b (μM) | Cytotoxicity CC50c (μM) | SId | Mpro Inhibitory Activity IC50e (μM) |
|---|---|---|---|---|---|---|
| 1 | 1–1 |  |
>50 | >500 | >10 | 141.5 ± 12.0 |
| 2 | 1–1 |  |
>50 | >500 | >10 | ND |
| 3 | 1–1 |  |
12.5 ± 2.1 | >500 | >40 | ND |
| 4 | 1–1 |  |
20.9 ± 8.5 | >500 | >24 | ND |
| 5 | 1–1 |  |
7.1 ± 3.5 | 207 ± 14 | 29 | 29.0 ± 3.7 |
| 6 | 1–1 |  |
3.0 ± 1.6 | >500 | >167 | >100 |
| 7 | 1–1 |  |
>50 | >500 | >10 | 110.7 ± 2.2 |
| 8 | 1–2 |  |
23.1 ± 5.5 | 68.8 ± 15.4 | 3 | ND |
| 9 | 1–3 |  |
>50 | >500 | >10 | ND |
| 10 | 1–3 |  |
>50 | >500 | >10 | 128.1 ± 18.8 |
| 11 | 1–3 |  |
>50 | >500 | >10 | ND |
| 12 | 1–3 |  |
20.7 ± 1.1 | 428 ± 11 | 21 | ND |
| 13 | 1–3 |  |
>50 | >500 | >10 | ND |
| 14 | 1–3 |  |
>50 | >500 | >10 | ND |
| 15 | 1–3 |  |
15.2 ± 2.5 | 113 ± 3 | 8 | ND |
| 16 | 1–3 |  |
36.0 ± 13.4 | 401 ± 52 | 10 | ND |
| 17 | 1–3 |  |
>50 | 228 ± 6 | >5 | ND |
| 18 | 1–3 |  |
>50 | >500 | >10 | ND |
| 19 | 1–3 |  |
7.2 ± 1.0 | 228 ± 69 | 32 | ND |
| 20 | 1–3 |  |
>50 | >500 | >10 | ND |
| 21 | 2 |  |
>50 | >500 | >10 | ND |
| 22 | 2 |  |
>50 | >500 | >10 | ND |
| 23 | 2 |  |
16.7 ± 5.9 | 433 ± 54 | 26 | ND |
| 24 | 2 |  |
11.2 ± 5.5 | >500 | >45 | ND |
| 25 | 3 |  |
8.1 ± 3.4 | >250 | >31 | 26.6 ± 7.4 |
| 26 | 3 |  |
9.8 ± 4.5 | 68.9 ± 10.0 | 7 | 57.6 ± 4.1 |
| 27 | 3 |  |
14.3 ± 9.6 | 67.9 ± 16.5 | 5 | 46.2 ± 7.7 |
| 28 | 3 |  |
>50 | >250 | >5 | ND |
| 29 | 3 |  |
9.4 ± 4.5 | >500 | >51 | ND |
| 30 | 3 | >50 | >500 | >10 | ND | |
| BOC | – |  |
22.0 ± 2.6 | >500 | >23 | 18.9 ± 6.5 |
| RMV | – |  |
0.15 ± 0.04 | >250 | >1667 | ND |
All data were obtained by analysis with nonlinear regression function of GraphPad Prism 8.0.
ND, Not Determined.
Virtual screening methods applied to identify each compound. Numbers refer to the workflows described in Fig. 1B.
50% Effective Concentration at half-maximal response, i.e., the compound concentration that inhibits 50% of plaque formation as determined by PRA against SARS-CoV-2. Reported values represent the means ± SD of data derived from n ≥ 3 independent experiments in duplicate.
Compound concentration that produces 50% of cytotoxicity, as determined by MTT assays at 72 h in Vero E6 cells. Reported values represent the means ± SD of data derived from n = 3 independent experiments in duplicate.
SI, Selectivity Index (determined as the ratio between CC50 and EC50).
50% Inhibitory Concentration at half-maximal response, i.e., the compound concentration that inhibits 50% of SARS-CoV-2 Mpro activity in vitro. Reported values represent the means ± SD of data derived from n ≥ 3 independent experiments in duplicate.
