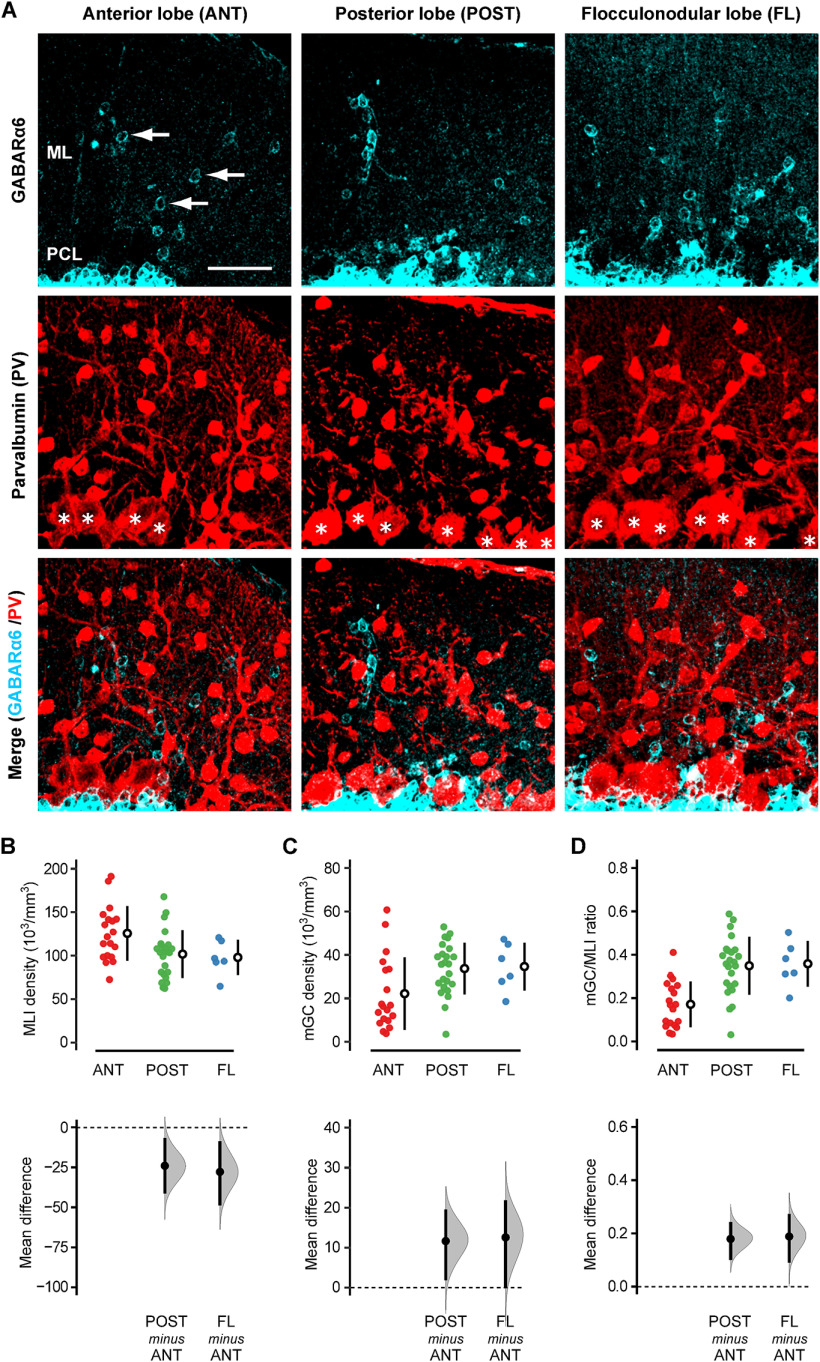
Figure 1.
Immunohistochemical detection of mGCs and MLIs. A, The sagittal cerebellar slices of B6 mice were double-stained with antibodies for GABAARα6 (cyan, top row) and PV (red, middle row). The merged images are shown in the bottom row. Note that GABAARα6 signals do not colocalize with the somata of PV-positive cells. The left, middle, and right columns show examples taken from the anterior lobe (ANT; Lobules I–V), posterior lobe (POST; Lobules VI–IX), and flocculonodular lobe (FL; lobule X), respectively. The arrows in the top row indicate examples of mGCs. The asterisks in the middle row indicate Purkinje cell somata. ML, molecular layer; PCL, Purkinje cell layer. Scale bar: 40 μm. B–D, The density of MLIs (B), mGCs (C), and the mGC/MLI ratio (D) were quantified in each lobe, and the mean differences between ANT versus POST and ANT versus FL were estimated by bootstrap resampling. In the top panels, the closed circles indicate individual FOVs taken from ANT (red; n = 19), POST (green; n = 24), and FL (blue; n = 6) of four mice. The open circles and vertical lines indicate the mean and standard deviation (SD), respectively. In the bottom panels, the gray curves indicate the resampled distribution of the mean difference between ANT versus POST (POST minus ANT) and ANT versus FL (FL minus ANT). The closed black circles and vertical lines indicate the observed mean difference and 95% confidence interval, respectively. The horizontal dashed line is the line of zero mean difference. The statistical significance (p < 0.05) is assessed whether the 95% confidence interval includes this zero-line or not. Furthermore, the sharpness of the resampled distribution (relative to the mean difference) and the proximity of the confidence interval to the zero-line allow us to infer the certainty of the difference. All the estimation graphics used in this study have the same structure.

