Figure 5.

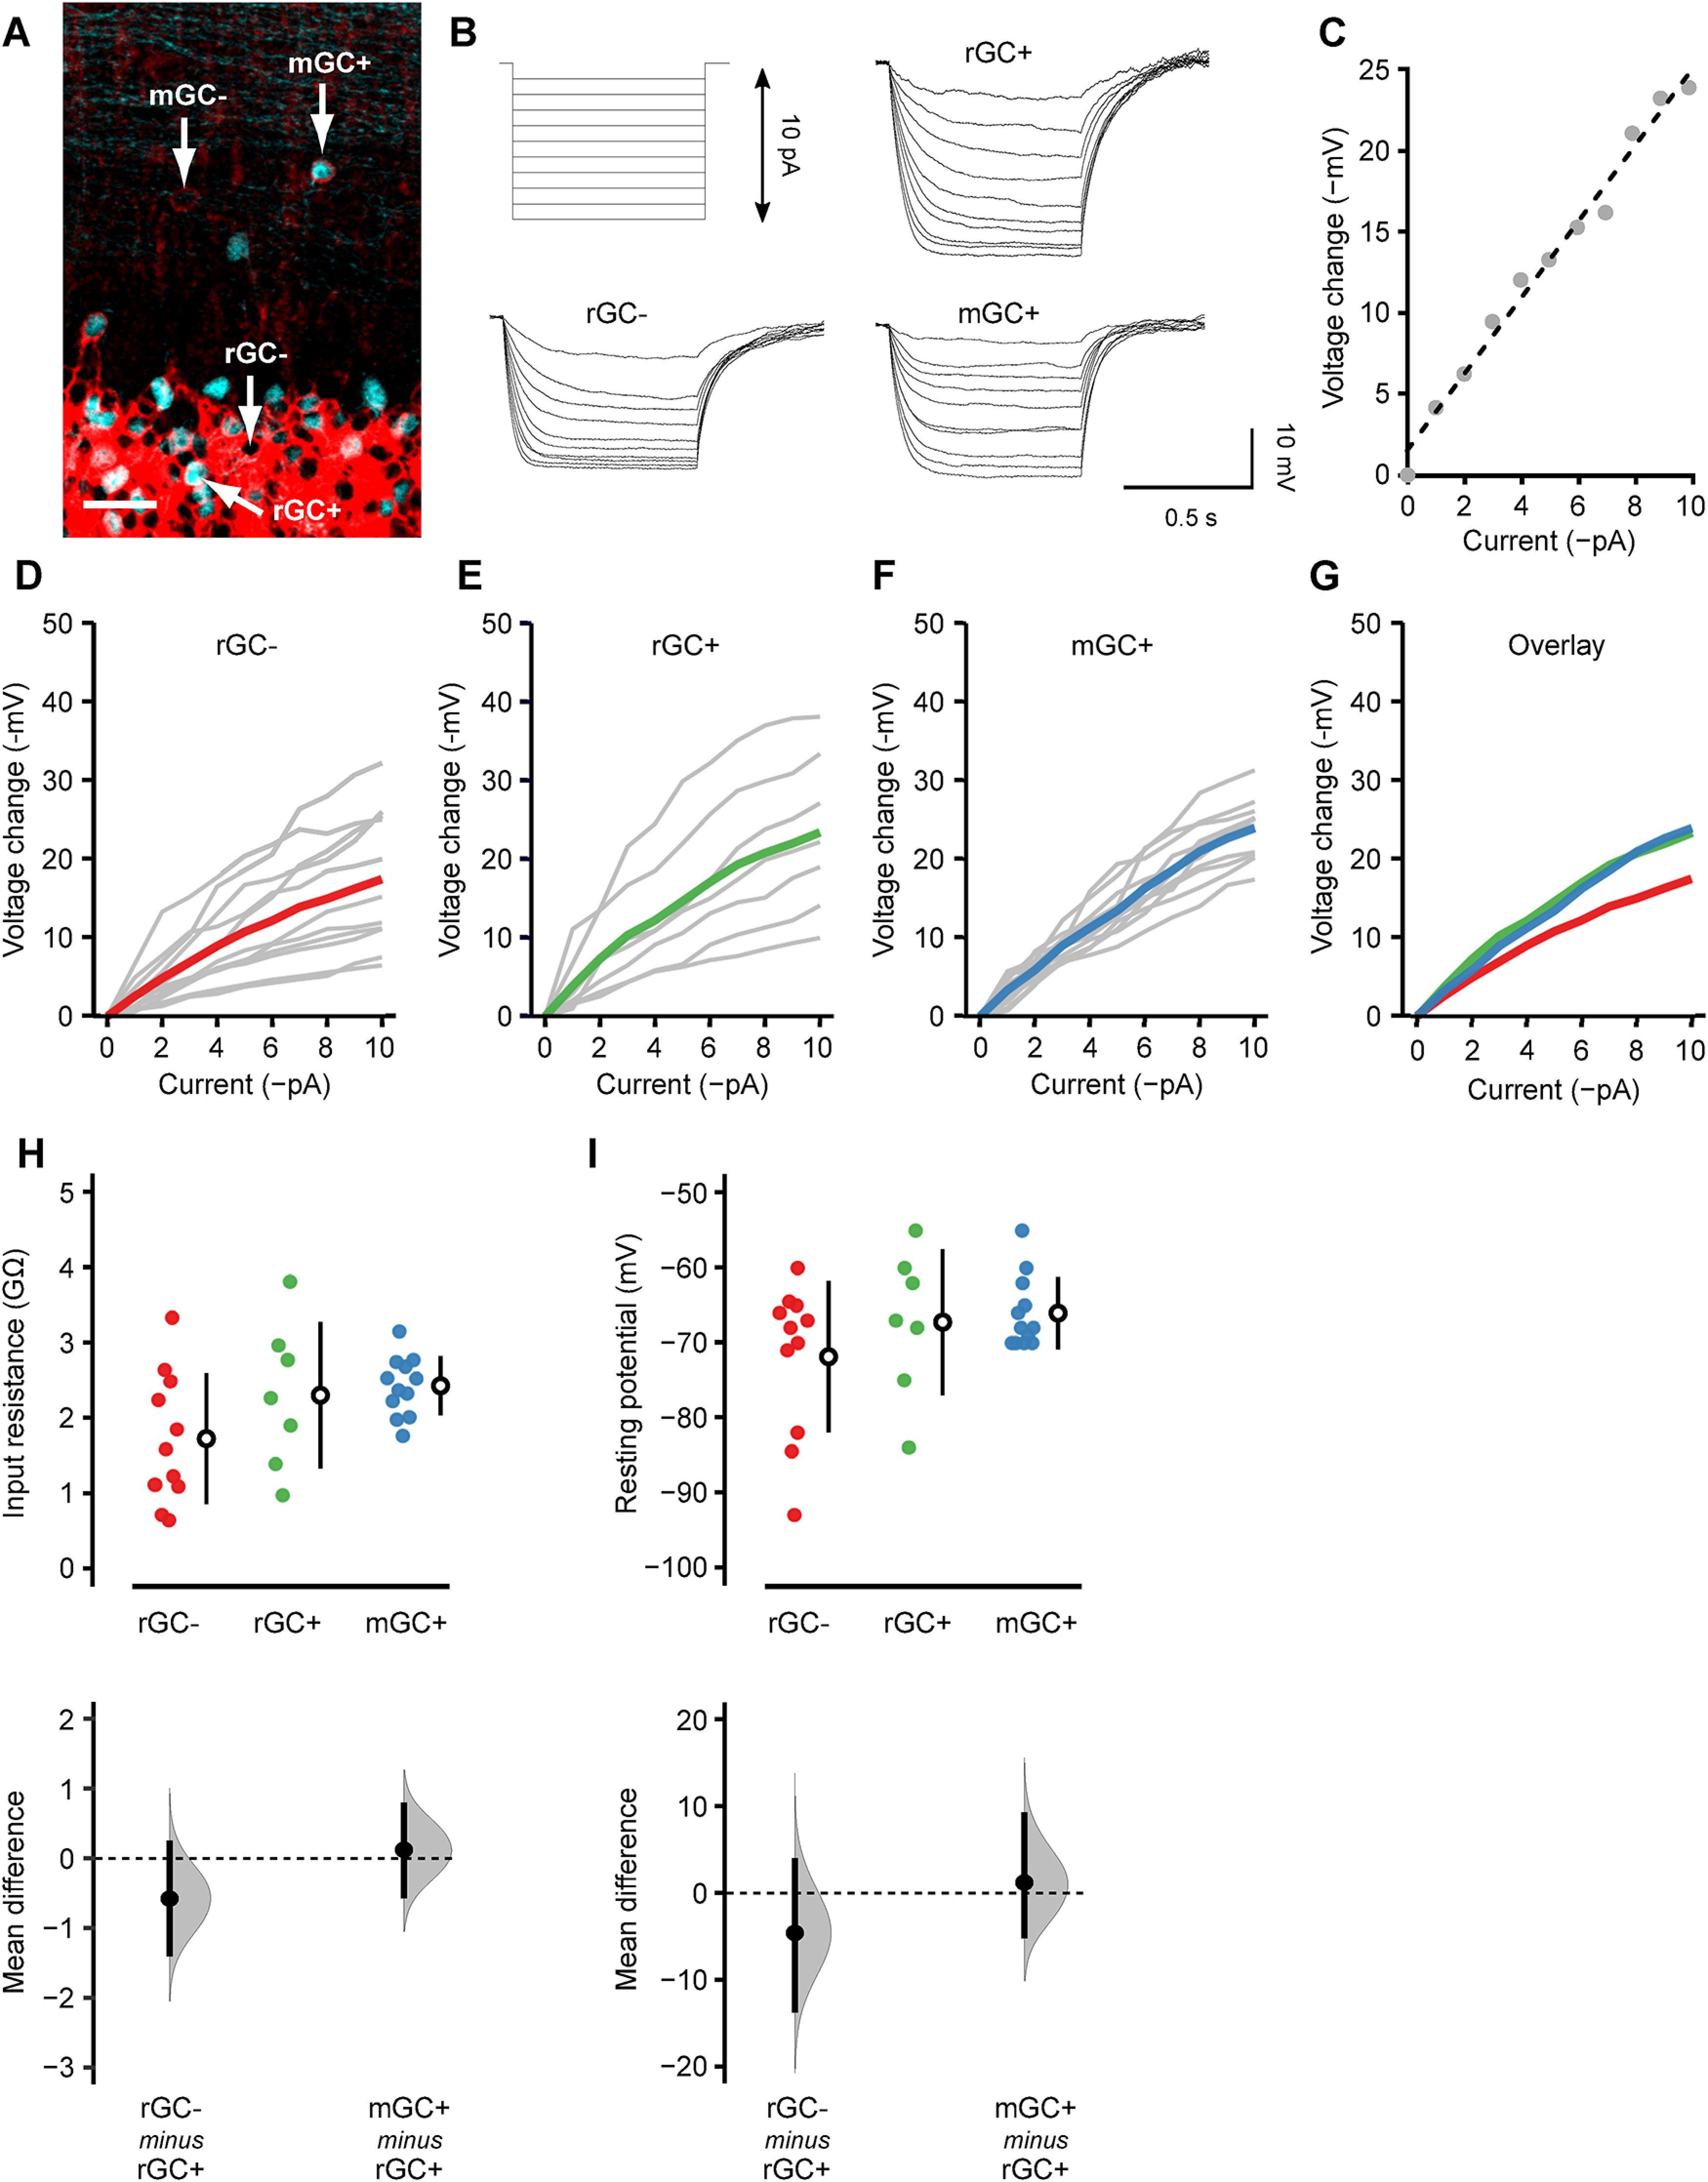
Passive membrane properties of mGCs. A, GABAARα6 (red) and mCitrine (cyan) double-labeling in a fixed tissue to show the identity of recorded cells. Whole-cell current-clamp recordings were made from rGC– (mCitrine-nonexpressing rGC), rGC+ (mCitrine-expressing rGC), and mGC+ (mCitrine-expressing mGC). mGC– (mCitrine-nonexpressing mGC) is invisible in living tissues, thus not recorded. Scale bar: 20 μm. B, Hyperpolarizing current steps (1-pA increment) injected into the cells (top, left) and the resultant membrane hyperpolarization in a rGC– (bottom, left), rGC+ (top, right), and mGC+ (bottom, right). C, A representative current–voltage (I–V) relationship (gray dots) and the linear regression line (dashed line). The input resistance of each cell was obtained as the slope of this linear regression line. D–F, The I–V relationship of rGC– (D), rGC+ (E), and mGC+ (F). Gray lines represent individual cells, and the colored lines represent the population average. G, The population averages of rGC– (red), rGC+ (green), and mGC+ (blue) are overlayed. H, I, The input resistance (H) and resting membrane potential (I) of rGC– (red; n = 11), rGC+ (green; n = 7), and mGC+ (blue; n = 12) were shown, and the mean differences between rGC+ versus rGC– and rGC+ versus mGC+ were estimated by bootstrap resampling. In the top panels, the closed circles indicate individual cells. The open circles and vertical lines indicate the mean and SD, respectively. In the bottom panels, the gray curves indicate the resampled distribution of the mean difference between rGC+ versus rGC– (rGC– minus rGC+) and rGC+ versus mGC+ (mGC+ minus rGC+). The closed black circles and vertical lines indicate the observed mean difference and 95% confidence interval, respectively. The horizontal dashed line is the line of zero mean difference.
