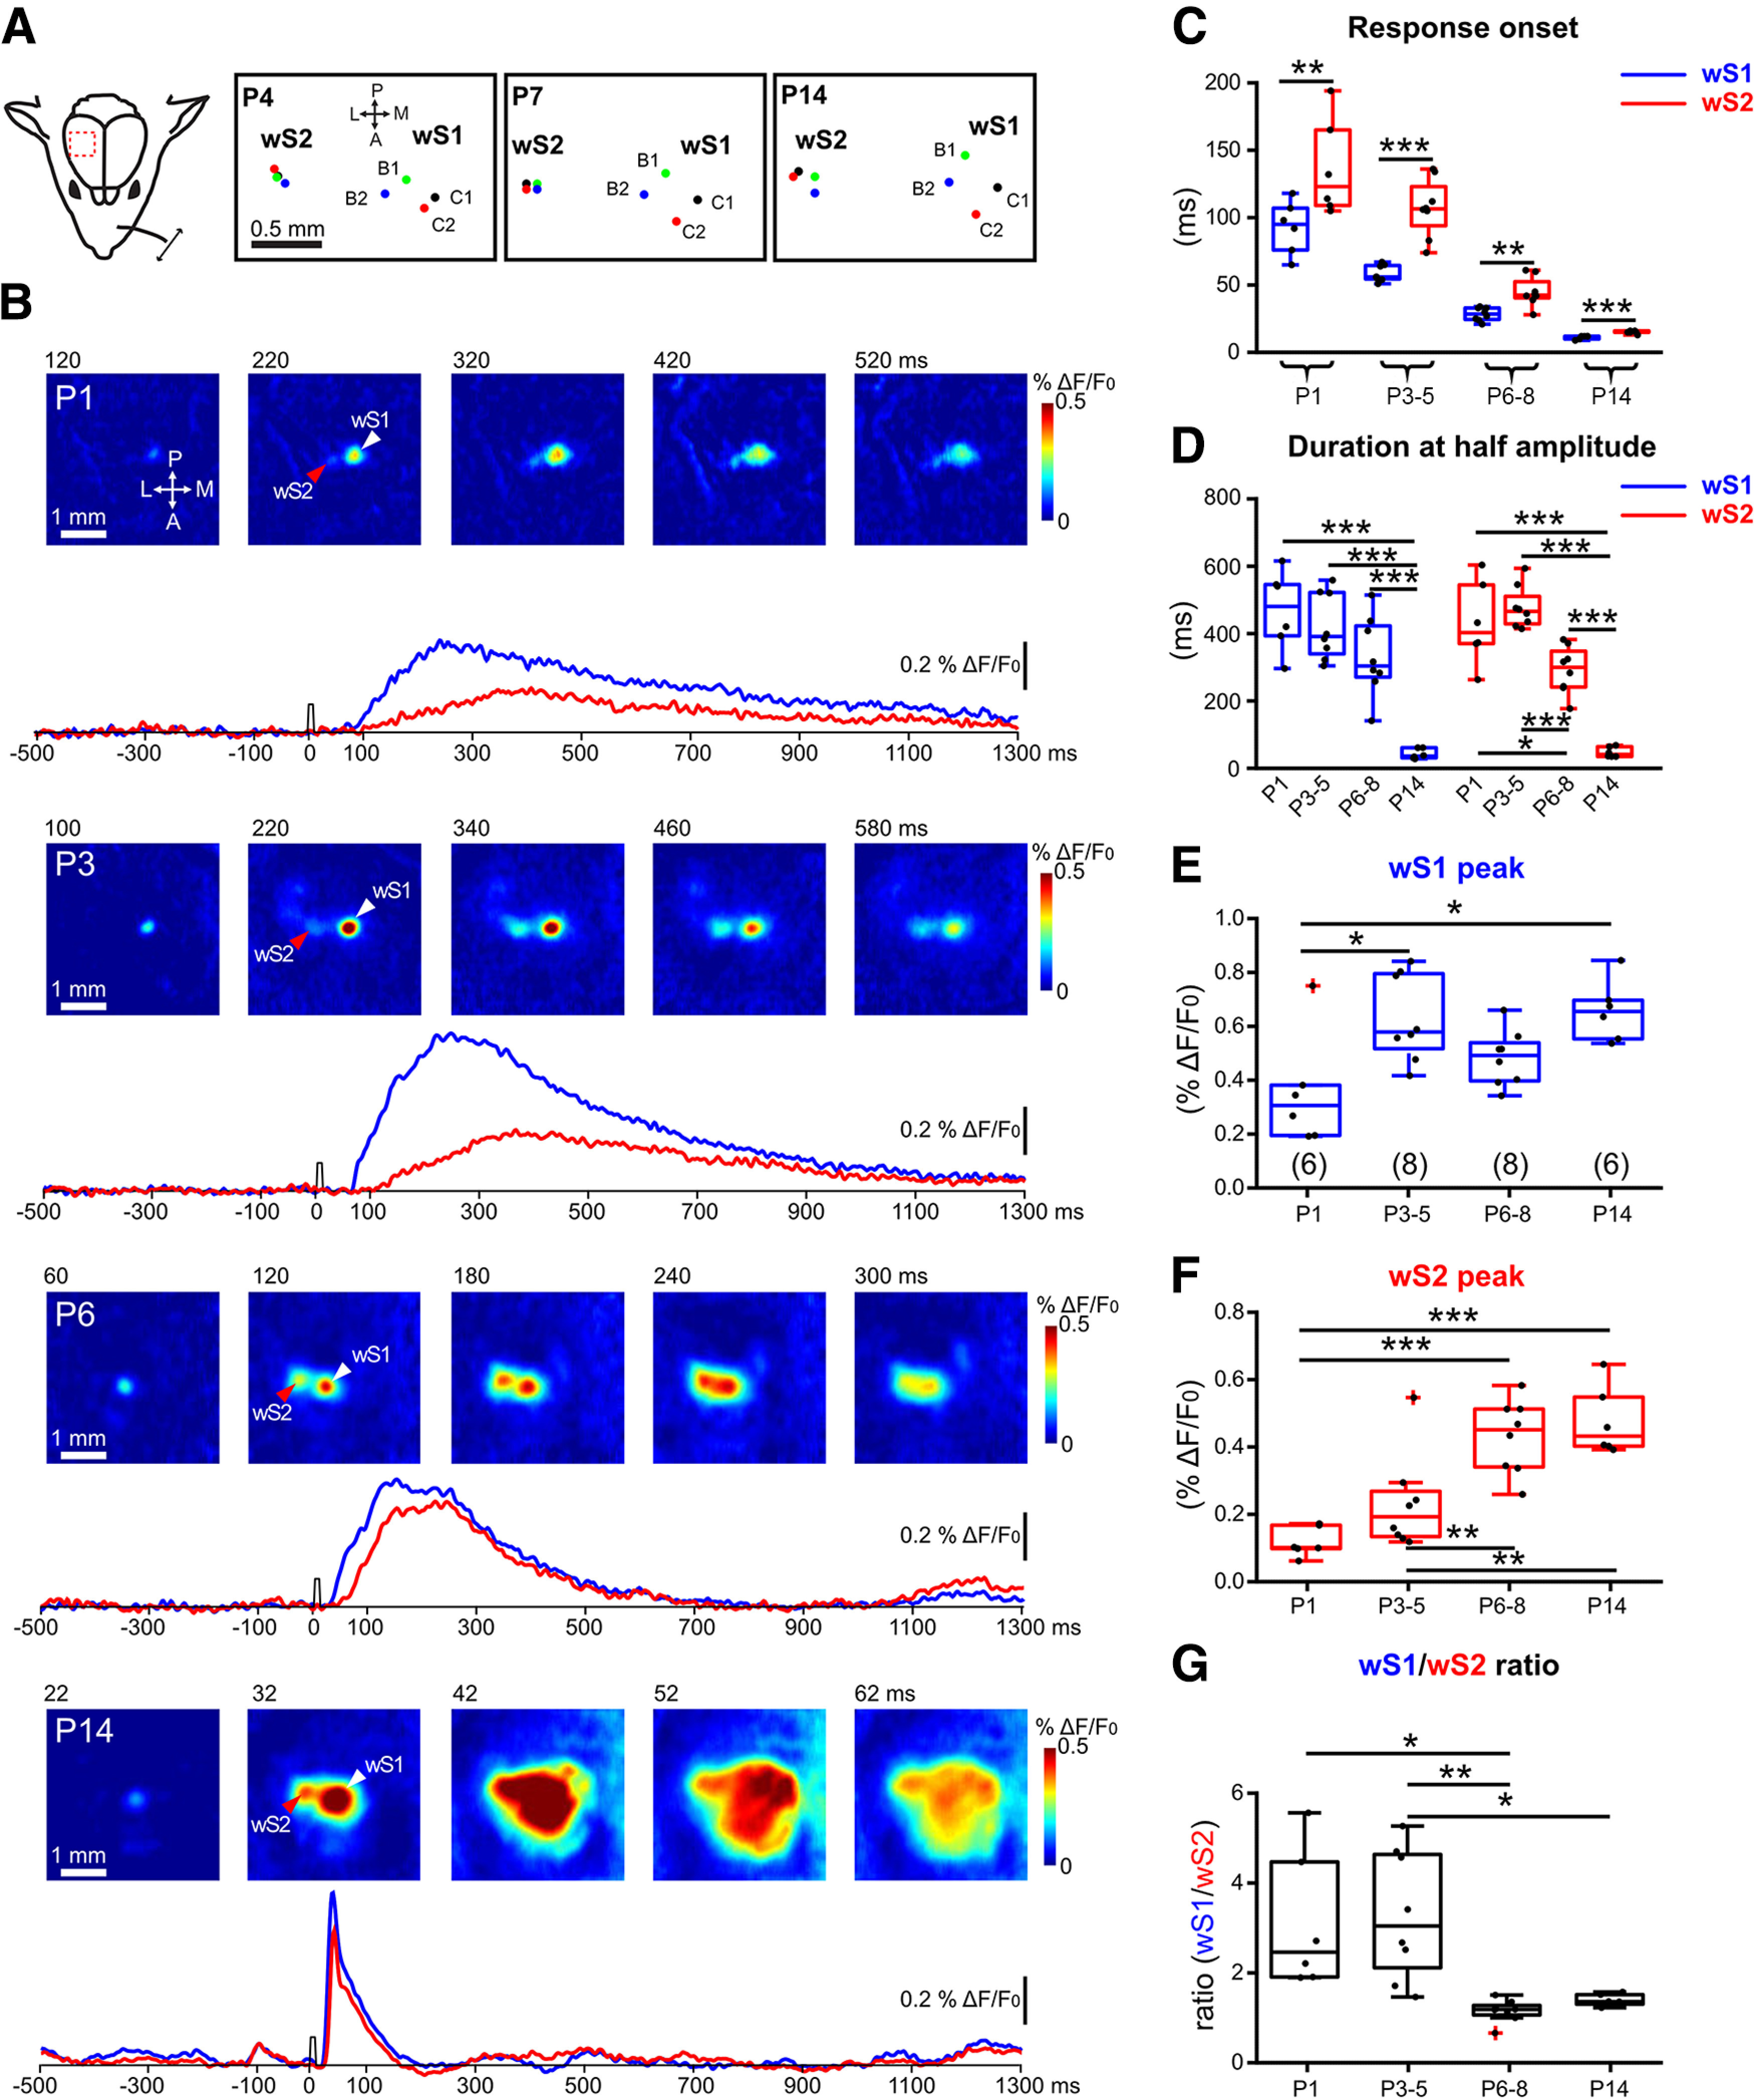
Figure 1.

Developmental changes of sensory-evoked VSDI responses in wS1 and wS2. A, Left, Schematic illustration of the experimental design. A single whisker deflection is performed together with VSDI of the whisker somatosensory cortex. Right, The spatial location of the representation of activity for four whiskers (B1, B2, C1, and C2) in wS1 and wS2 in a P4, P7, and P14 mouse. B, VSDI of responses elicited by B3-whisker deflection in different age groups of WT mice (P1, P3, P6, and P14). White arrowhead indicates the center of the wS1 response. Red arrowhead indicates the center of the wS2 response. Bottom row, 1.8-s-long optical recording traces obtained by analyzing the signal in the centers of wS1 and wS2 over time (blue trace for wS1 and red trace for wS2). Time point of whisker stimulation at 0 ms. C, The onset times of evoked responses in wS1 and wS2 in the different age groups. Asterisks indicate significant difference between wS1 and wS2 using a paired t test. P1: p = 0.0041, t = 5.007; P3-P5: p = 0.0001, t = 7.631; P6-P8: p = 0.0015, t = 5.063; p = 0.0005, t = 8.032. D, The duration at the half-maximal amplitude of VSDI for different age groups in wS1 and wS2. Statistics: one-way ANOVA with Bonferroni's multiple comparison test. S1: p < 0.0001; S2: p < 0.0001. E, Box plot represents the evoked peak amplitude in the center of wS1 in the different age groups (n = 6 barrels from N = 3 P1 mice; n = 8 barrels from N = 4 P3-P4 mice; n = 8 barrels from N = 4 P6-P8 mice; n = 6 barrels from N = 3 P14 mice). Statistics: one-way ANOVA with Bonferroni's multiple comparison test. p = 0.0044. F, Box plot represents the evoked peak amplitude in the center of wS2 in the different age groups. Statistics: one-way ANOVA with Bonferroni's multiple comparison test. p < 0.0001. G, Box plot represents the evoked peak amplitude in wS1 divided by the evoked peak amplitude in wS2 in the different age groups. Statistics: ANOVA with Bonferroni's multiple comparison test. p = 0.0006. *p < 0.05; **p < 0.01; ***p < 0.001. All the values of data points and the mean and SEM of each group are in Extended Data Figure 1-1.
