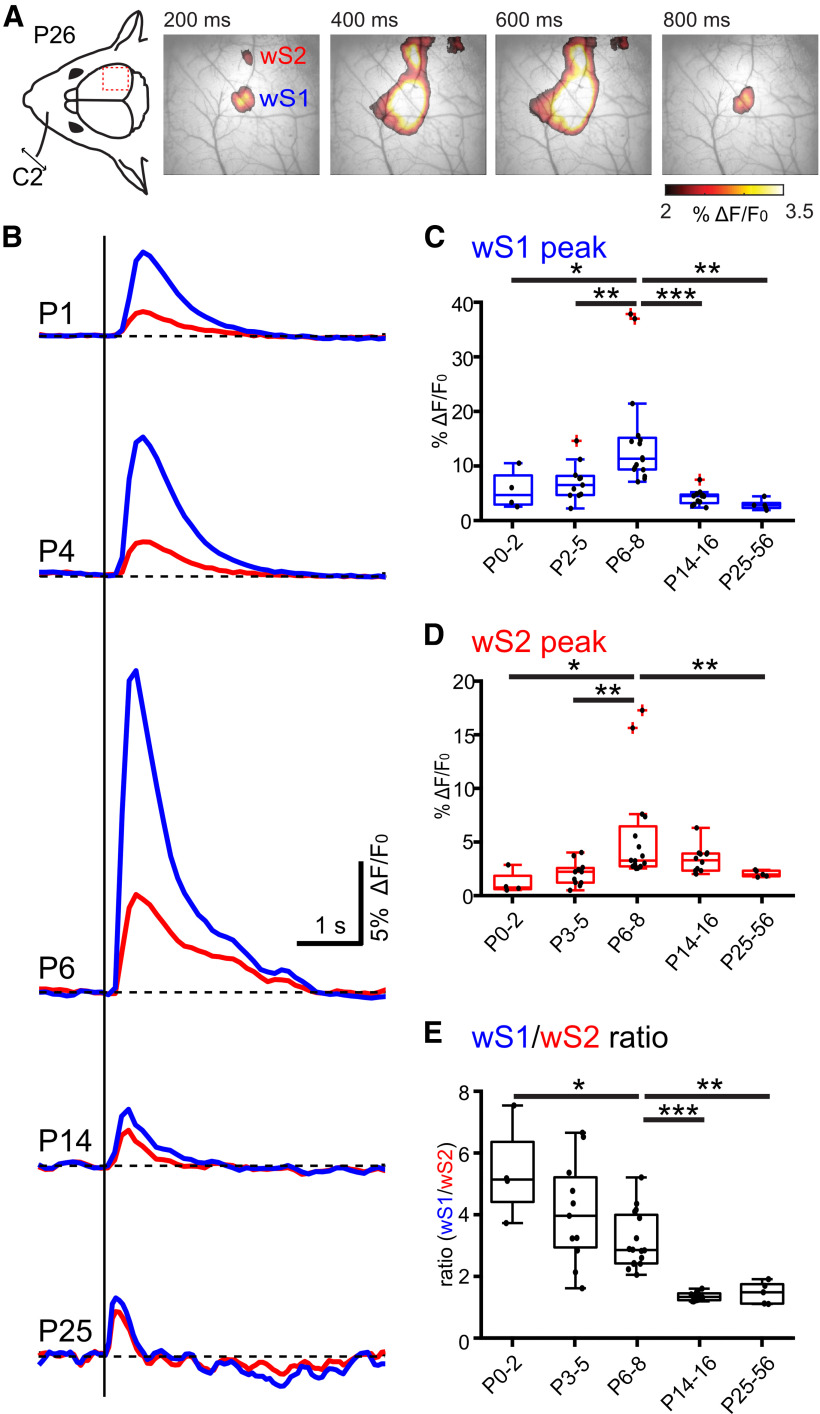
Figure 2.
Developmental changes of sensory-evoked responses in wS1 and wS2 monitored with wide-field calcium imaging. A, Left, Schematic illustration of the experimental design. A single whisker deflection is performed together with calcium imaging of the whisker somatosensory cortex of a P26 Snap25-GCamp6 mouse. Right, Evoked wide-field calcium imaging response at different time points after single C2 whisker deflection at 0 ms. Clearly separated responses in wS1 and wS2 are visible at 200 ms. B, Temporal profile of wide-field calcium imaging responses recorded in the center of wS1 (blue trace) and wS2 (red trace) at different ages (P1, P4, P6, P14, and P25) following C2-whisker stimulation. C, Box plot represents the evoked peak amplitude in the center of wS1 for different age groups (N = 4 P0-P2 mice; N = 11 P3-P5 mice; N = 16 P6-P8 mice; N = 11 P9-P12 mice; N = 5 P25-P56 mice). Statistics: Mann–Whitney test. P0-P2 versus P3-P5: p = 0.02; P3-P5 versus P6-P8: p = 0.002; P6-P8 versus P14-P16: p < 0.0001; P6-P8 versus P25-P56: p = 0.001. D, Box plot represents the evoked peak amplitude in the center of wS2 for different age groups. Statistics: Mann–Whitney test. P0-P2 versus P6-P8: p = 0.0123; P3-P5 versus P6-P8: p = 0.0012; P6-P8 versus P25-P56: p = 0.0011. E, Box plot represents the evoked peak amplitude in wS1 divided by the evoked peak amplitude in wS2 for different age groups. Statistics: Mann–Whitney test. P0-P2 versus P6-P8: p = 0.0206; P6-P8 versus P14-P16: p < 0.0001; P6-P8 versus P25-P56: p = 0.0011. In box plots, black dots represent the data points; red + signs indicate outliers. *p < 0.05; **p < 0.01; ***p < 0.001. All the values of data points and the mean and SEM of each group are in Extended Data Figure 2-1.

