Figure 3.
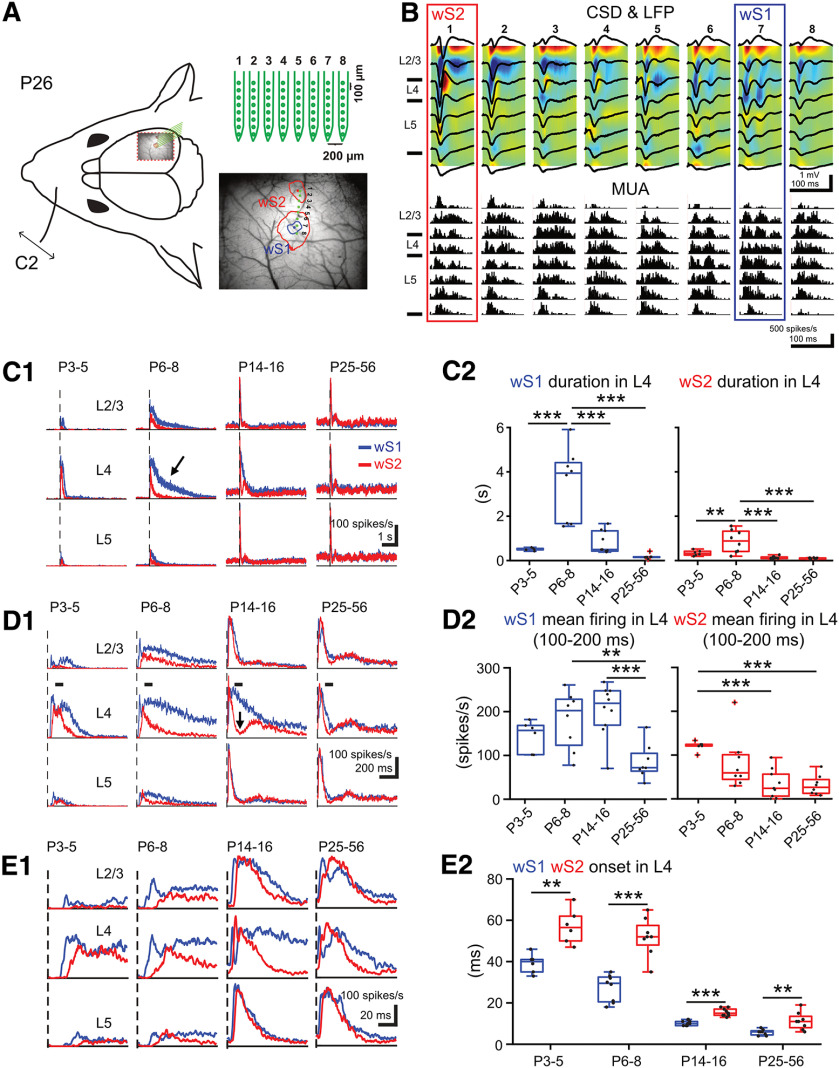
Developmental changes of sensory-evoked MUA in wS1 and wS2. A, Left, Schematic illustration of the experimental design showing the insertion position of an 8 × 8 multielectrode probe array into wS1 and wS2 after identifying the center of evoked wS1 and wS2 by a single C2 whisker deflection in a Snap25-GCamp6 P26 mouse. Right, An example showing the evoked wide-field calcium imaging response (mean response from 11-40 ms after the onset of stimulation) in wS1 and wS2 by single C2 whisker deflection in a P26 mouse. We set 4% ΔF/F0 as the threshold to separate the evoked area of wS1 and wS2 (the red contour plot) and 5.5% ΔF/F0 as the threshold to confine the evoked area of wS1 (the blue contour plot). Blue dot indicates the center of evoked wS1. Red dot indicates the center of evoked S2. Eight green dots indicate the insertion location of the 8 × 8 multielectrode probe array. B, Example of evoked local field potential (LFP) responses (black lines), color-coded CSD plots, and corresponding MUA responses elicited by a single C2 whisker deflection in a P26 mouse. The cortical layers (L2-3, L4, and L5) were identified by the evoked CSD pattern. C1, Grand averages of evoked MUA responses recorded in L2-3, L4, and L5 of wS1 and wS2 (1 s before and 5 s after onset of stimulation) in 4 age groups (n = 6 in P3-P5, n = 8 in P6-P8, n = 10 in P14-P16, n = 8 in P25-P56). C2, Box plots represent the duration of evoked MUA of wS1 and wS2 in L4 of the different age groups. Statistics: ANOVA with Bonferroni's multiple comparison test. S1: p < 0.0001; S2: p = 0.0004. D1, Same as in C1, but with higher temporal resolution showing only the first second after the onset of stimulation. D2, Box plots represent the mean firing rate of L4 in wS1 and wS2 between 100 and 200 ms after stimulus in the different age groups. Statistics: ANOVA with Bonferroni's multiple comparison test. S1: p < 0.0001; S2: p = 0.0002. E1, Same as in C1, but with higher temporal resolution showing only the first 100 ms after stimulus. E2, Box plots represent the evoked onset time of MUA in L4 of wS1 and wS2 for the different age groups. Statistics: paired t test. P3-P5: p = 0.0028, t = 5.47; P6-P8: p < 0.0001, t = 9.31; P14-P16: p < 0.0001, t = 10.11; P25-P56: p = 0.0017, t = 4.92. In box plots, black dots represent the data points; red + signs indicate outliers. *p < 0.05; **p < 0.01; ***p < 0.001. All the values of data points and the mean and SEM of each group are in Extended Data Figure 3-1.

