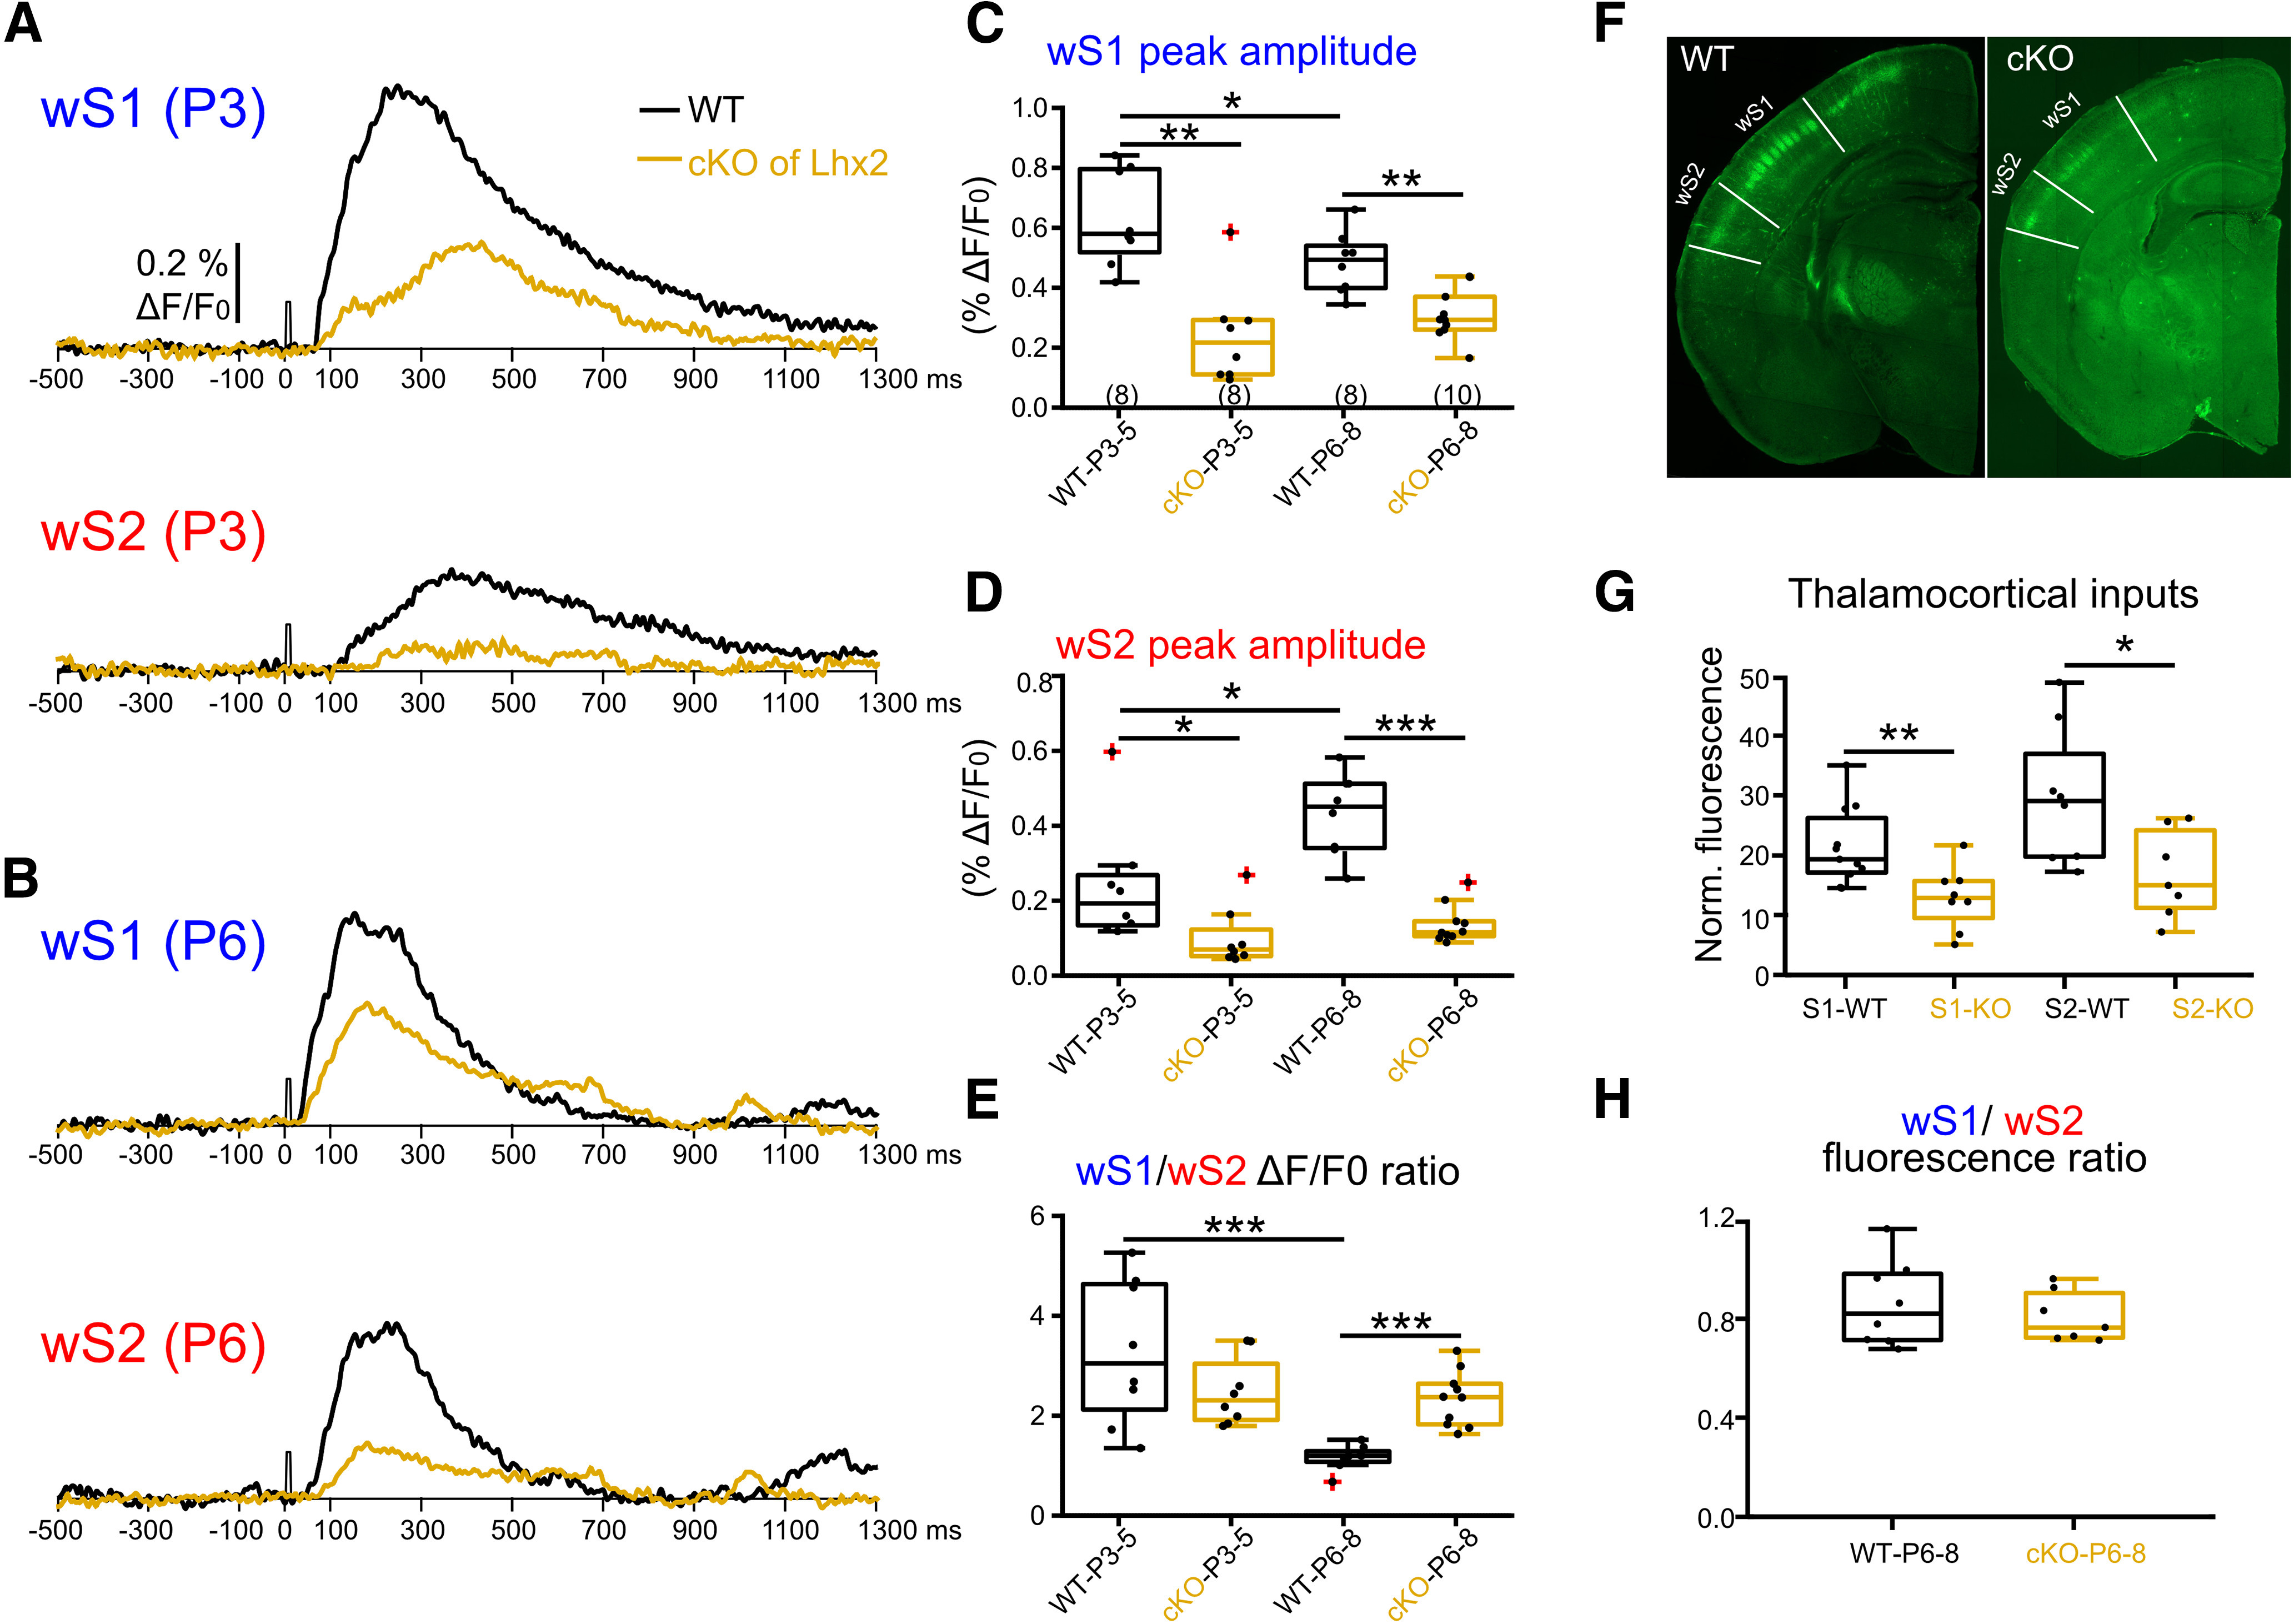
Figure 5.

Postnatal removal of Lhx2 from cortical excitatory cells leads to an arrest in the developmental progression of wS2 sensory-evoked activity. A, An example trace of evoked VSDI recorded in the center of wS1 and wS2 from a P3 WT (black trace) and a P3 Lhx2 cKO mouse (orange trace). B, An example trace of evoked VSDI recorded in the center of wS1 and wS2 from a P6 WT and a P6 Lhx2 cKO mice. C, Box plots represent the peak amplitude of evoked VSDI in wS1 of WT and cKO mice for the two age groups (n = 8 recordings from N = 4 P3-P4 WT mice; n = 8 recordings from N = 4 P3-P4 cKO mice; n = 8 recordings from N = 4 WT P6-P8 mice; n = 10 recordings from N = 6 P6-P8 cKO mice). Statistics: Mann–Whitney test. WT P3-P5 versus KO P3-P5: p = 0.0019; WT P6-P8 versus KO P6-P8: p = 0.0021; WT P3-P5 versus WT P6-P8: p = 0.0499. D, Same as in C, but for wS2. Statistics: Mann–Whitney test. WT P3-P5 versus KO P3-P5: p = 0.0207; WT P6-P8 versus KO P6-P8: p < 0.0001; WT P3-P5 versus WT P6-P8: p = 0.0148. E, Box plots represent the evoked peak amplitude of VSDI in wS1 divided by the evoked peak VSDI amplitude in wS2 for the different age groups. Statistics: Mann–Whitney test. WT P3-P5 versus WT P6-P8: p = 0.0006; KO P3-P5 versus KO P6-P8: p = 0.63; WT P3-P5 versus KO P3-P5: p = 0.3823; WT P6-P8 versus KO P6-P8: p < 0.0001. F, Example P7 brain images of Lhx2 WT (Lhx2f/f:TCA-GFP) and Lhx2 cKO (Lhx2f/f:NexCre:TCA-GFP) with wS1 and wS2 area indicated. G, Box plots represent the normalized TCA-GFP fluorescent signal in wS1 and wS2 of WT and cKO mice at P6-P8 (n = 11 wS1 from N = 3 P6-P8 WT mice; n = 8 wS2 from N = 3 P6-P8 WT mice; n = 8 wS1 from N = 3 P6-P8 cKO mice; n = 7 wS2 from N = 3 P6-P8 cKO mice). Statistics: Mann–Whitney test. S1 WT versus S1 KO: p = 0.0073; S2 WT versus S2 KO: p = 0.0205. H, Box plots represent the TCA-GFP fluorescence in wS1 divided by the TCA-GFP fluorescence in wS2 for both WT and cKO P6-P8 age group (n = 8 from N = 3 P6-P8 WT mice, n = 7 from N = 3 cKO mice). Statistics: Mann–Whitney test. p = 0.78. *p < 0.05; **p < 0.01; ***p < 0.001. All the values of data points and the mean and SEM of each group are in Extended Data Figure 5-1.
