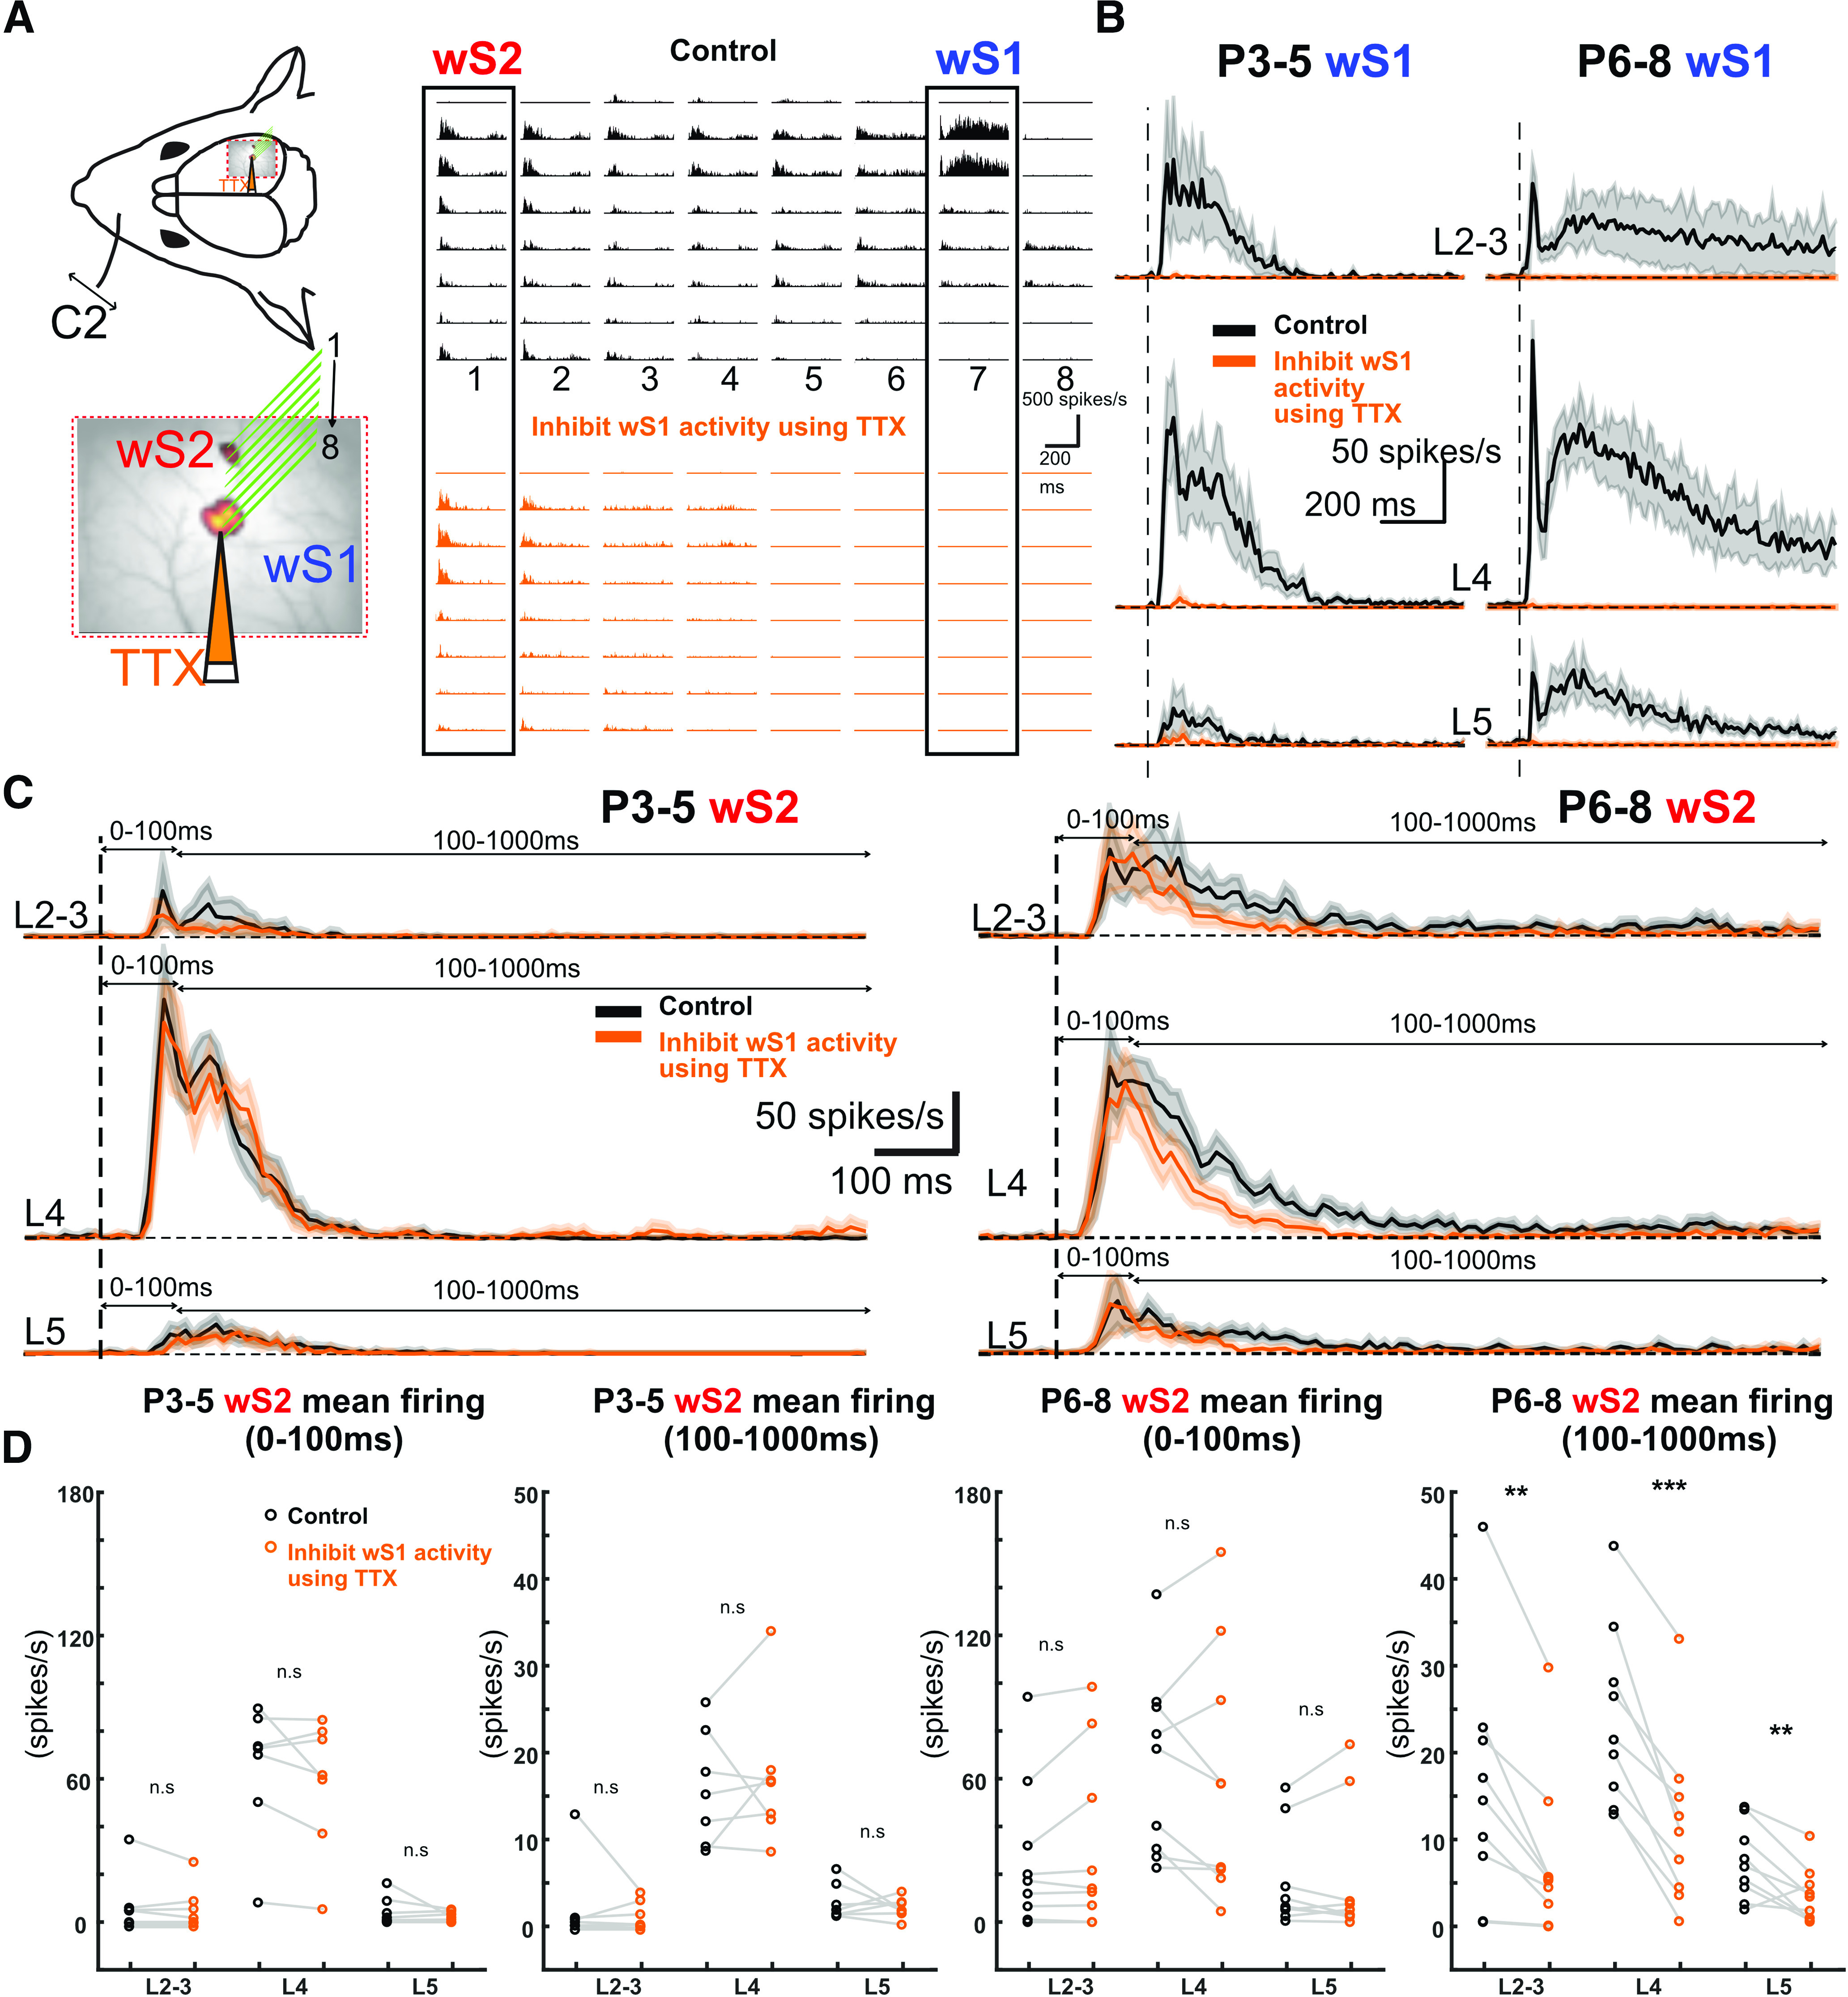
Figure 6.

Acute inhibition of wS1 activity differently influences sensory-evoked responses of S2 over development. A, Left, A schematic illustration showing the insertion position of an 8 × 8 silicon probe array in wS1 and wS2. TTX was injected into wS1 through a micro-glass pipette (orange). Right, An example of evoked MUA recorded in wS1 and wS2 after C2 whisker deflection in a P8 mouse in the control condition (black) and after local TTX injection in wS1 (orange). B, Average traces of evoked wS1 MUA in L2-3, L4, and L5 of the P3-P5 age group (left, n = 7) and P6-P8 age group (right, n = 9). Black trace represents before injecting the TTX (control). Orange trace represents TTX injection. Shaded areas represent SEM. C, Average traces of evoked wS2 MUA in L2-3, L4, and L5 of the P3-P5 age group (left, n = 7) and P6-P8 age group (right, n = 9). Black trace represents before injecting the TTX (control). Orange trace represents TTX injection. Shaded areas represent SEM. D, wS2 evoked MUA mean firing rate (spike/s) in L2-3, L4, and L5 for the time windows of the first 100 and 100-1000 ms in P3-P5 (n = 7) and P6-P8 (n = 9) age groups. Black represents before TTX injection in wS1. Orange represents after TTX injection in wS1. Statistical comparison was performed between control and TTX injection conditions using the paired t test for both time windows, both age groups, and all the layers: **p < 0.05; ***p < 0.001. P6-P8 wS2 100-1000 ms L2: p = 0.004, t = 3.99; P6-P8 wS2 100-1000 ms L4: p < 0.0001, t = 7.22; P6-P8 wS2 100-1000 ms L5: p = 0.009, t = 3.41. All the values of data points, the mean and SEM of each group, and statistical p and t values are in Extended Data Figure 6-1.
