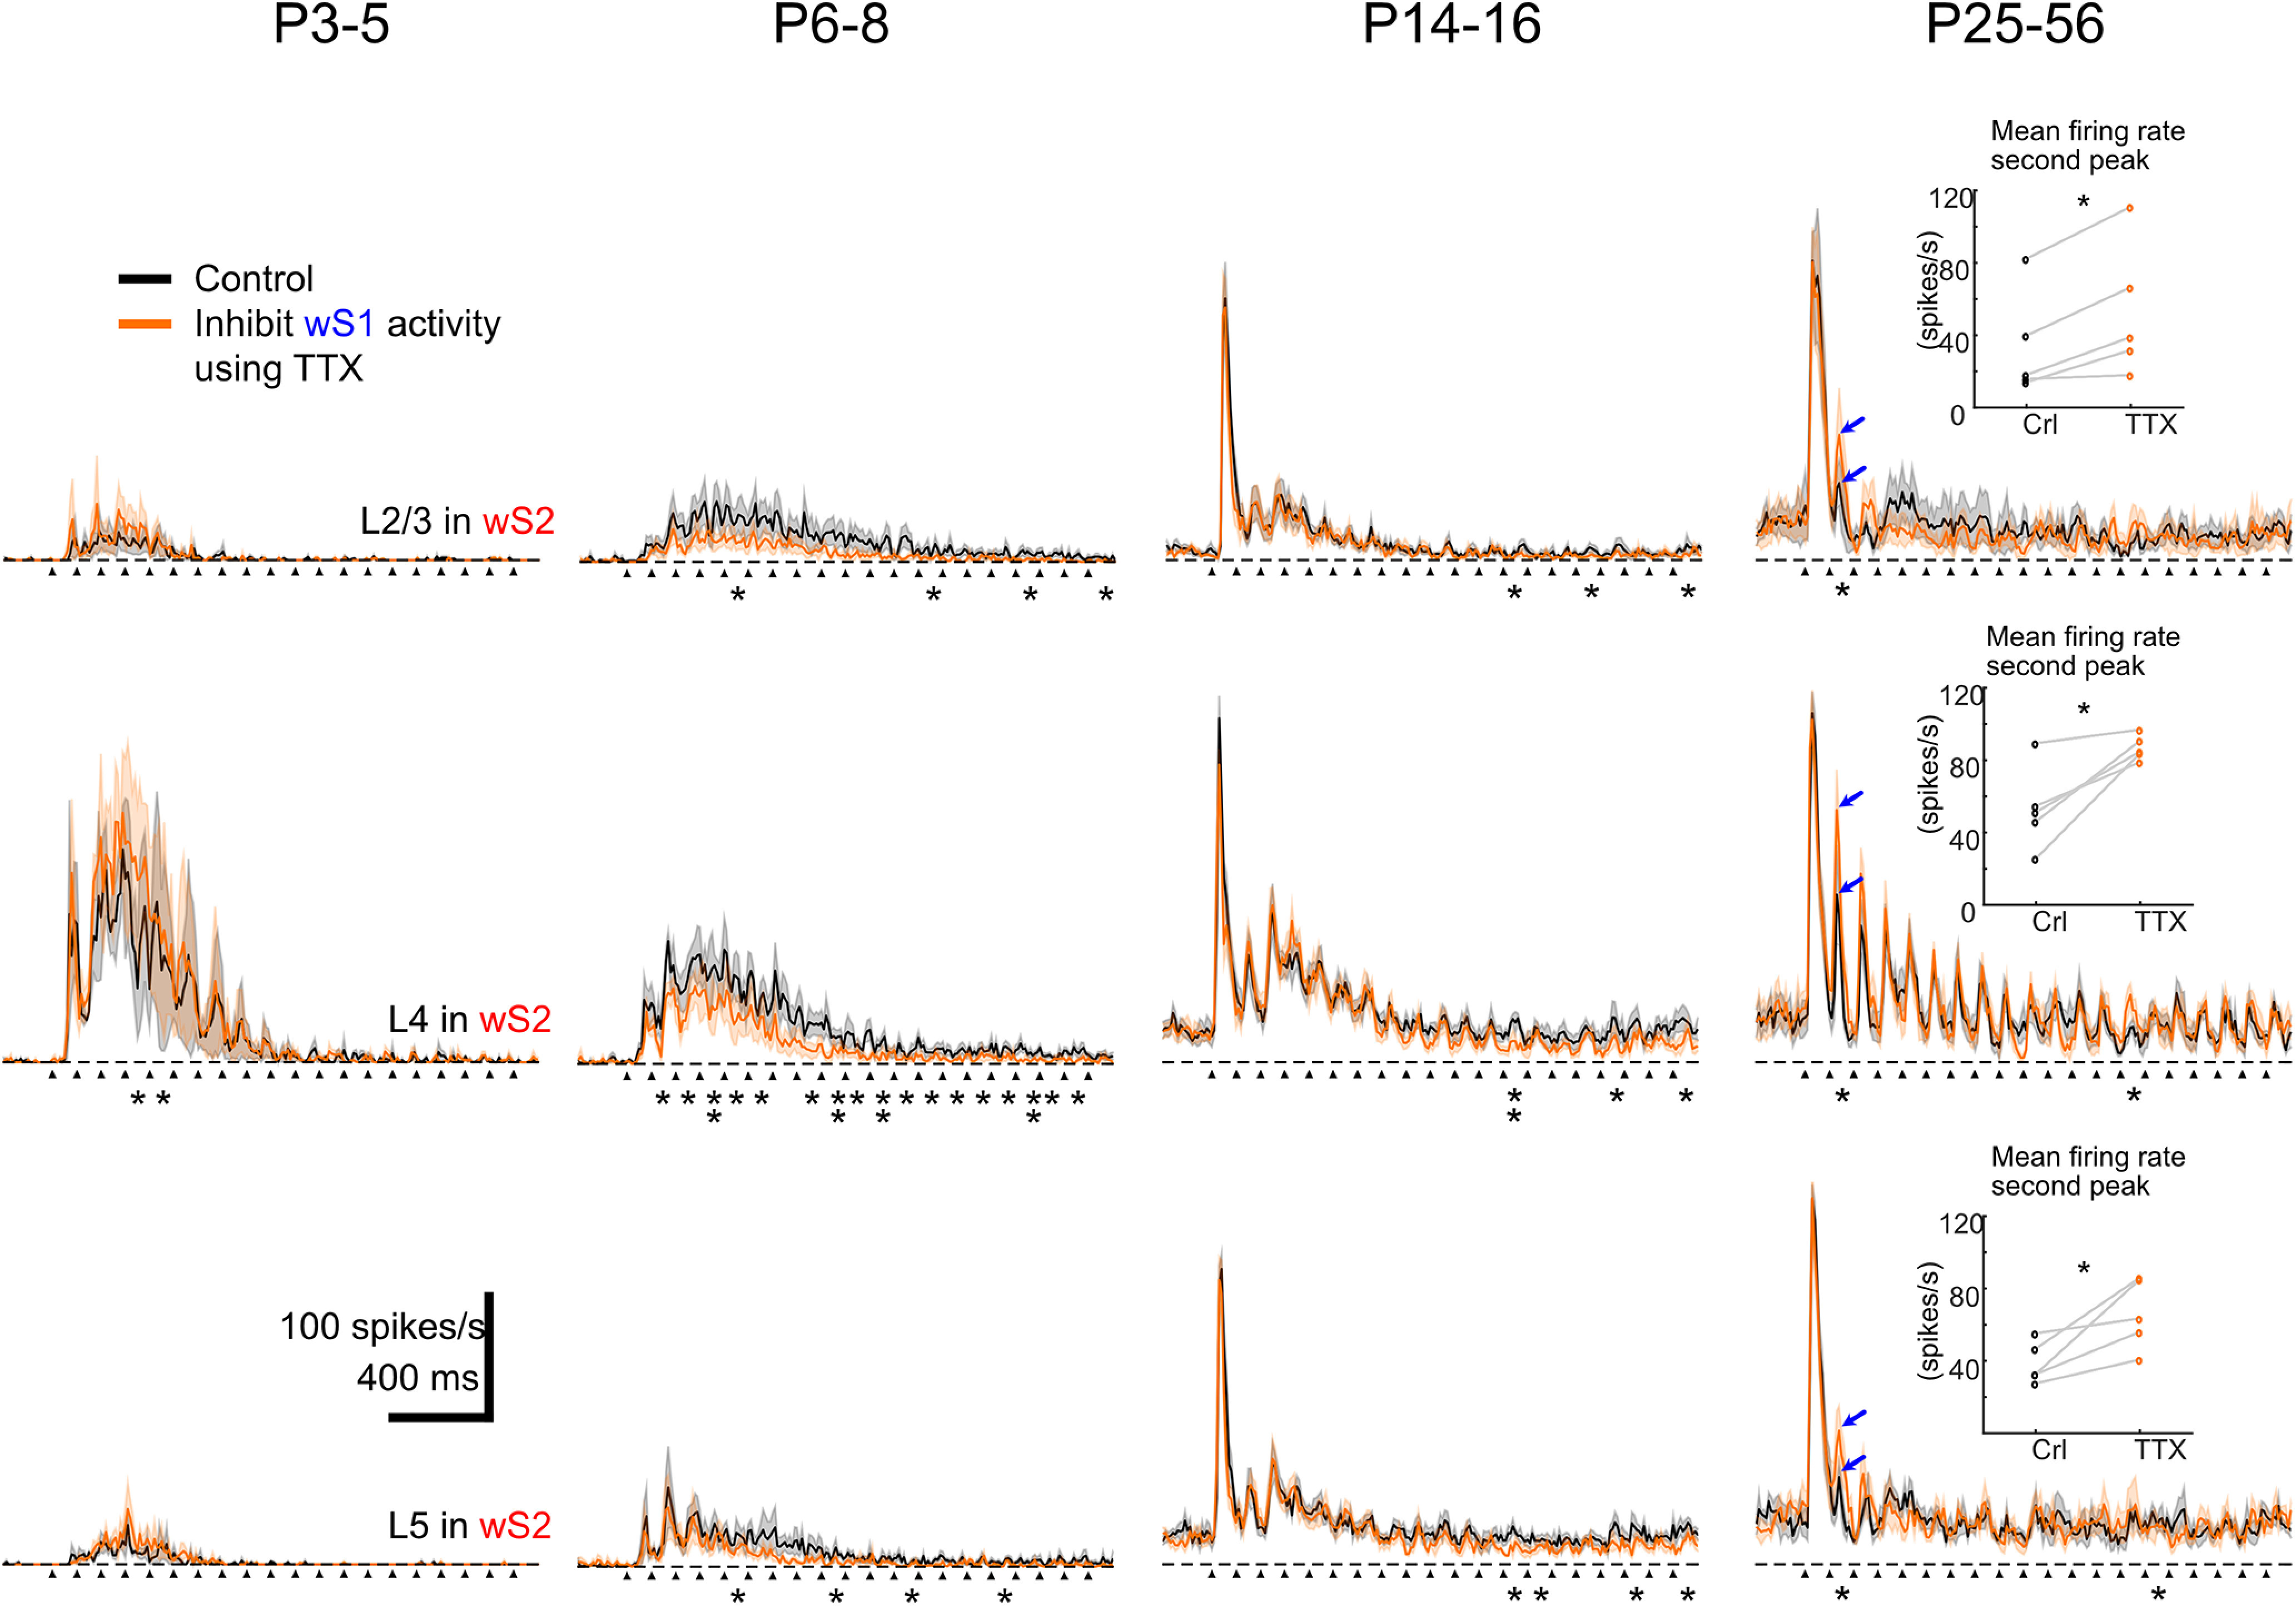
Figure 8.

Inhibiting S1 influences the sensory-evoked response of S2 by single whisker deflection at 10 Hz for 2 s. Average of evoked MUA response in L2-3, L4, and L5 of P3-P5 (n = 3), P6-P8 (n = 6), P14-P16 (n = 7), and P25-P56 (n = 5) age groups of mice. Black arrows indicate the onset of whisker deflection. Asterisks indicate significant difference between control and TTX injection conditions using the paired t test during the period of 0-100 ms after the onset of each whisker stimulation. Inserted plots at P25-P56 are the mean firing rate during the period of 0-100 ms after the onset of the second whisker stimulation at L2-3, L4, and L5. Blue arrows indicate the peaks of averaged MUA response after the second whisker stimulation. Statistical comparison was performed between control and TTX injection conditions using the paired t test for all the 100 ms time windows. *p < 0.05. **p < 0.01. All the values of data points and statistical p values are in Extended Data Figure 8-1.
