. 2022 May 16;13(22):6669–6686. doi: 10.1039/d1sc05681f

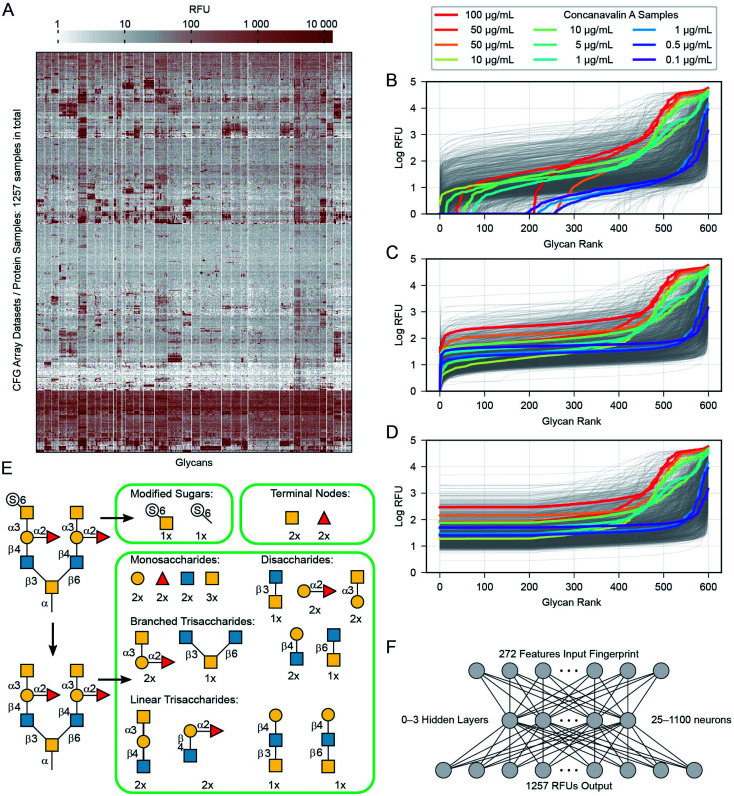
Fig. 3. Pre-processing of data. (A) Heatmap of the data overall, with all glycans and protein samples, each row and column has been clustered, appearing next to similar rows and columns. (B) The 599 mean RFU values for each protein are sorted and plotted as a line. Most of the 1257 proteins appear as a grey line, but several samples of the protein concanavalin A at various concentrations are highlighted in colour (due to the sorting, glycans appear at different x-axis positions for each protein). (C) The raw values are incremented as needed to place the minimum at 1.0. (D) The lowest 1/3rd (200 values) are replaced with the 200th value to reduce noise in the training data. (E) Details of the subgraph features used to describe each glycan. (F) Diagram illustrating the neural network architectures we used in this work. One hidden layer is shown, although we experimented with networks that contained zero to three hidden layers.

Fig. 3