. 2022 May 16;13(22):6669–6686. doi: 10.1039/d1sc05681f

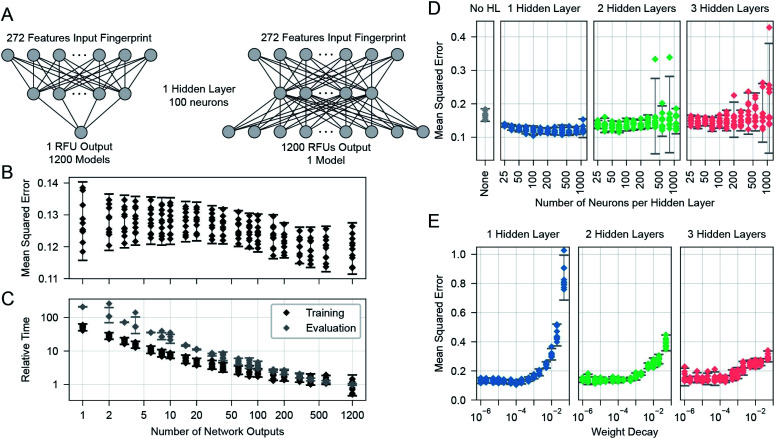
Fig. 4. Searches were used to find optimal parameters and settings. (A) Effect of varying the number of outputs of the neural networks, from one (corresponding to a single protein sample), to 1200, corresponding to this number of protein samples. (B) The mean-squared error, as a function of the number of outputs. Multiple models with each output size were trained to evaluate the same set of 1200 protein samples for all output size cases. (C) Overall relative training and evaluation times to produce the 1200 outputs. Evaluation time points are for a single evaluation of the models on all 599 glycans (producing one 599 glycan × 1257 protein sample output set) and are often overlapping in the plot except for occasional outliers. (D) The cross-validated MSE effects of altering the number of hidden layers and their number of neurons. (E) Effect of varying the weight decay parameter of the ADAM optimiser. In (B) to (E): each error bar is from n = 10 points, one from each of the 10 folds of a single run across 599 glycans. Error bars show the 95% confidence interval for a Gaussian of the same mean and standard deviation as the plotted points.

Fig. 4