. 2022 May 16;13(22):6669–6686. doi: 10.1039/d1sc05681f

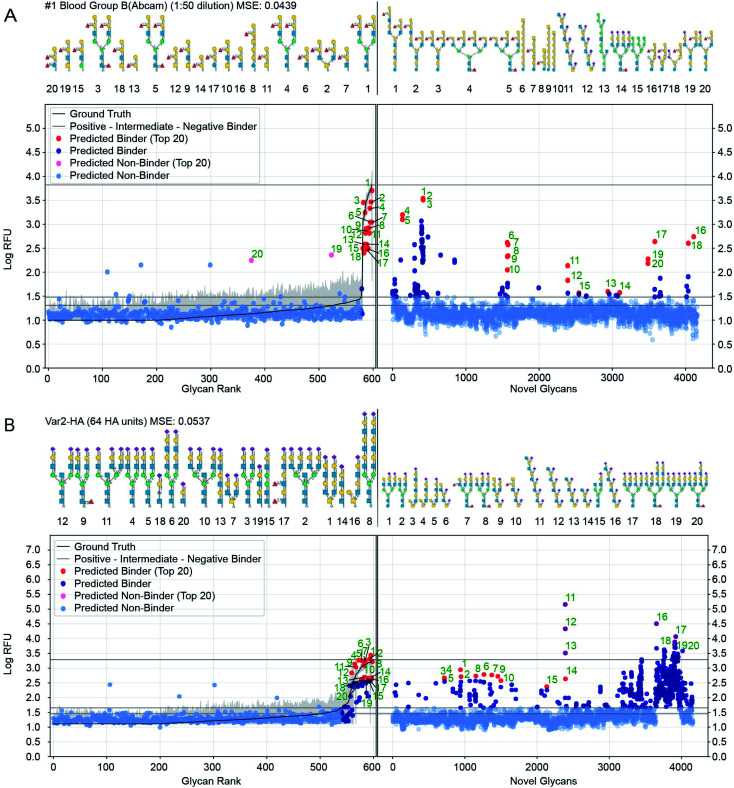
Fig. 7. Prediction of glycan binding of Blood Group B (1 : 50 dilution) and Influenza Var-2-Hemagglutinin to a set of 4160 novel glycans. On the left of the plots are the GlyNet predictions across the 599 CFG glycans highlighting (in red) the 20 glycans with the highest log-RFU values (strongest binding), with structures shown above the plots. On the right are predictions of glycan binding on the set of 4160 novel glycans (ordered alphabetically), similarly highlighting 20 strongly binding glycans from across the set and drawing their structures above the plots. Also shown is the reference mean CFG data (black line) and its 95% CI (grey line) with N = 6. Glycan structures drawn with DrawGlycan-SNFG.2.

Fig. 7