. 2022 May 16;13(22):6669–6686. doi: 10.1039/d1sc05681f

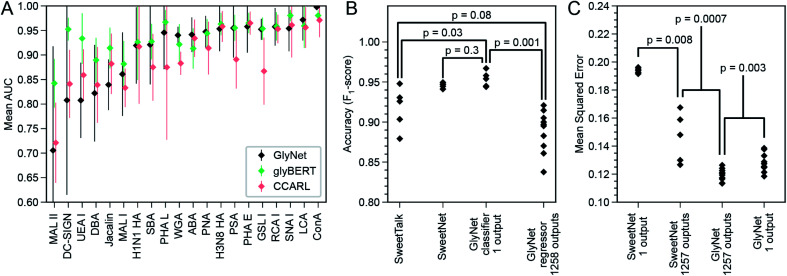
Fig. 8. Comparison of GlyNet with CCARL, SweetTalk, SweetNet, and GlyBERT. (A) Performance of GlyNet, CCARL and glyBERT evaluated using Area Under the ROC Curve (AUC) on CV-folds for 20 proteins; while CCARL obtained a mean AUC value of 0.895, GlyNet-class obtained a better mean value of 0.912 as well as outperforming CCARL on 13 of the 20 examples; error bars are ±1 standard deviation. (B) Comparison with SweetTalk and SweetNet on the immunogenicity data. Individual points are F1-scores for the different hold-out folds. Reported p-values from comparing F1-score distributions by Mann–Whitney U-test (SweetTalk, SweetNet, and GlyNet 1-output n = 5; 1258 outputs, n = 10; ST vs. 1 output: U = 2, common language effect size f = 0.08; SN vs. 1 output: U = 7, f = 0.28; ST vs. 1258 outputs: U = 10, f = 0.2; 1 output vs. 1258 outputs: U = 0, f = 0). (C) Comparison with SweetNet on the CFG glycan array data using both single- and multi-output networks. Reported p-values are from comparing distributions of MSEs of cross-validation hold-out folds by M.-W. U-test (SweetNet n = 5; GlyNet n = 10; SN 1- vs. multi-output: U = 0, f = 0; GN 1- vs. multi-output: U = 12, f = 0.12; SN vs. GN multi-output: U = 0, f = 0). Note the GlyNet distributions are the same as in Fig. 4B.

Fig. 8