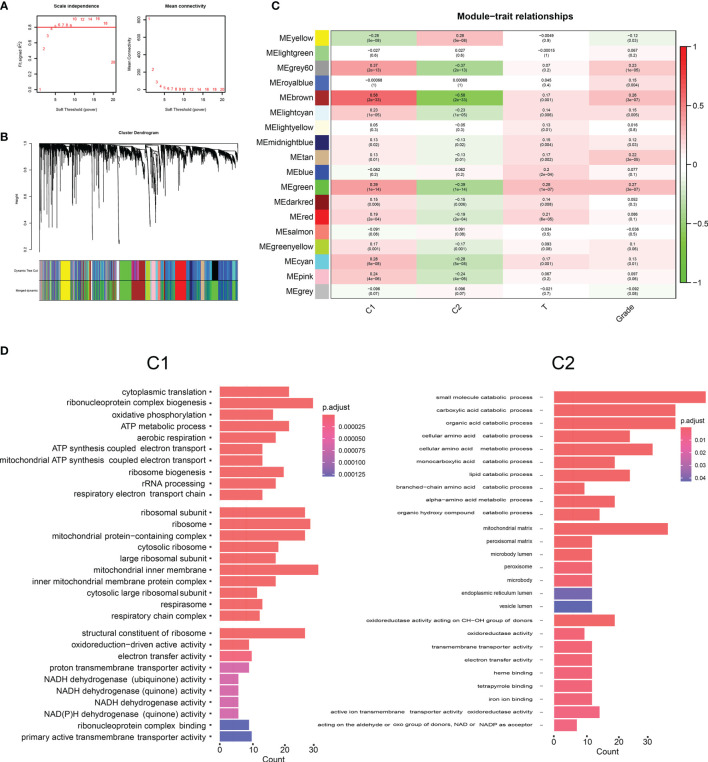
Figure 3.
(A) Network topology analysis for different soft threshold powers. (B) A hierarchical clustering tree was constructed, with each leaf representing a gene and each branch representing a co-expression module. A total of 18 co-expression modules were generated. (C) The correlation coefficients between two molecular phenotypes, T stages, grade, and co-expression modules. (D) The primary enrichment biological pathways of co-expression modules of two molecular types.

