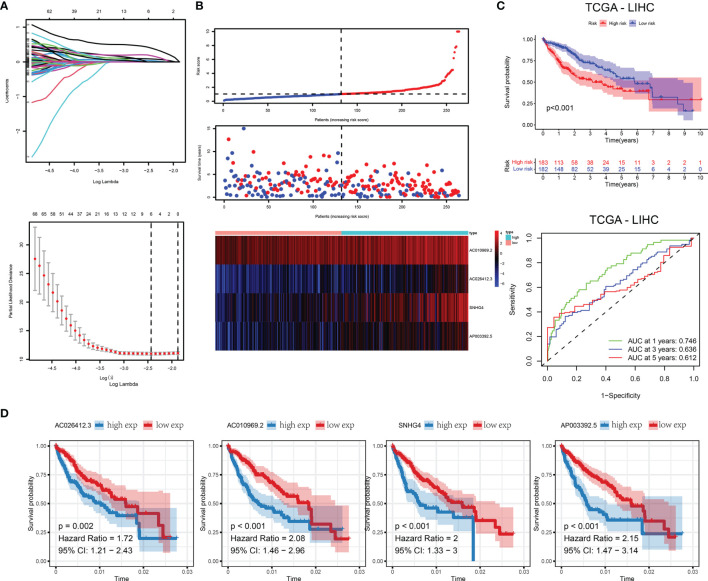
Figure 4.
(A) Trajectories for each independent variable and confidence intervals for different values. (B) Distribution of RiskScore and survival status of 4-gene signature. (C) In the training set, the survival curve of the four-gene signature and the ROC curves of 1, 3, and 5 years. (D) Kaplan-Meier survival curves of four genes.

