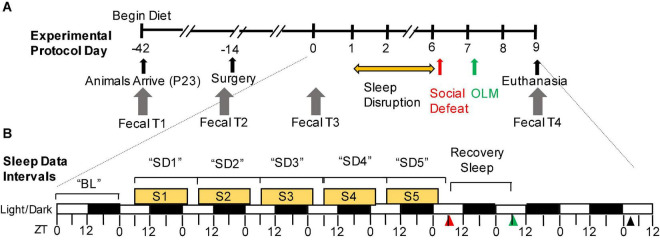
FIGURE 1.
Experimental timeline. (A) Overview of the experimental protocol. Experimental protocol days are depicted along the axis of the timeline. The yellow horizontal arrow denotes the sleep disruption portion of the protocol. The red and green arrows denote social defeat and object learning memory, respectively. Days of fecal sample collection are indicated with gray arrows. (B) Detail of indicated period that includes the sleep disruption protocol, social defeat stress (red arrowhead), object location memory (green arrowhead), and terminal sample collection (black arrowhead). Tick marks along the bottom of the timeline axis indicate Zeitgeber time (ZT) on that day, white/black rectangles indicate 12-h light/dark phases, and yellow rectangles indicate time periods of sleep disruption for the sleep-disrupted groups (ZT6-ZT2). EEG/EMG recording intervals, as used in the forthcoming figures, are indicated above the timeline. BL, baseline; OLM, object location memory; P, postnatal day; S, 20-h sleep disruption window; SD, 24-h sleep disruption day; ZT, Zeitgeber time.

