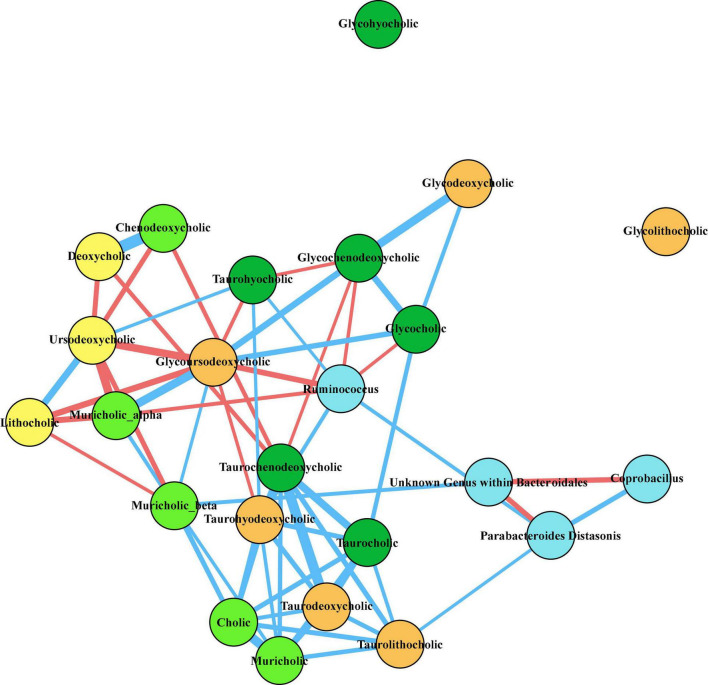
FIGURE 7.
Correlation network of taxa of interest and fecal bile acids at T3. Twenty bile acids were identified from untargeted LC/MS/MS mass spectrometry of fecal samples collected at the time of baseline sleep (T3). Pairwise Spearman’s rank order correlations of bile acids and relative abundances of fecal bacteria of interest were performed across all animals, and correlations that were significant after correcting for multiple comparisons (q < 0.05) are depicted in the network diagram above. Nodes are colored as follows: light blue, bacteria; light green, primary bile acids; dark green, conjugated primary bile acids; yellow, secondary bile acids; orange, conjugated secondary bile acids. The thickness of the line between nodes correlates to the magnitude of Spearman’s rho, blue lines indicate positive rho values, and red lines indicate negative rho values.

