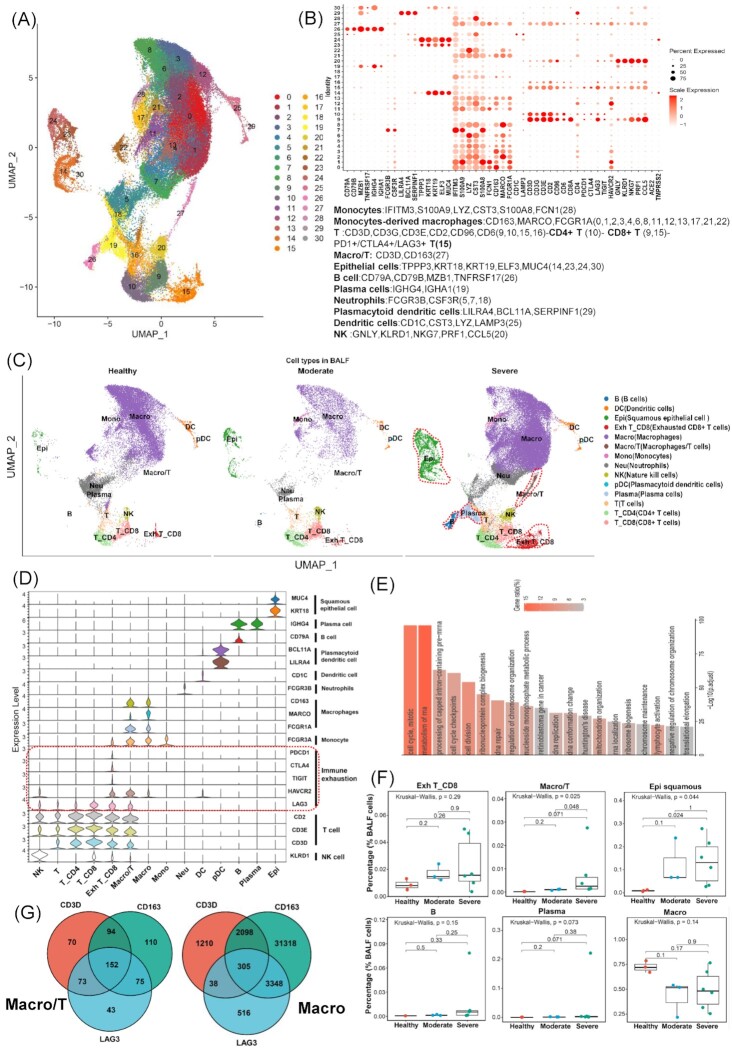
Figure 1.
Identification of cell types in BALF and cell–cell interaction of exhausted CD8 T cells. (A) Overview of the cell clusters in BALFs (n = 12) derived from across healthy people (n = 3), moderate (n = 3), and severe (n = 6) COVID-19 patients. (B) Dot plots show the expression level of canonical markers representing cell types and genes related to SARS-CoV-2 entry into cells. Cell types and their corresponding genes are listed at the bottom. Each dot is colored according to the scale expression and sized by the percentage of cells in a cluster (row) which expresses a given gene (column). (C) UMAP plots of BALF colored by cell types across three disease states including healthy (left panel), moderate (middle panel), and severe (right panel). (D) Violin plots show the expression of canonical maker genes (rows) which represent the distinct cell types (columns) and multiple inhibitory receptors indicating TEX. (E) Top 20 pathway/process enrichment analysis of all highly expressed genes in exhausted CD8 T cells; adjusted P value < 0.0001 (hypergeometric test, adjusted P-values obtained by the Benjamini–Hochberg procedure). (F) The cell percentages of Exh T_CD8, Macro/T, Epi squamous, B, Plasma, and Macro cells among healthy controls (n = 3), moderate patients (n = 3), and severe patients (n = 6). The Kruskal–Wallis H test was used for comparing the three disease states. (G) Venn diagrams display the numbers of cells concurrently expressing CD3D, CD163, and LAG3 in Macro/T (left panel) and Macro (right), respectively. B, B cells. DC, dendritic cells. Epi, squamous epithelial cells. Exh T_CD8, exhausted CD8 T cells. Macro, macrophages. Macro/T, a mixture of macrophages and T cells. Mono, monocytes. Neu, neutrophils. NK, nature kill cells. pDC, plasmacytoid dendritic cells. Plasma, plasma cells. T, T cells. T_CD4, CD4 T cells. T_CD8, CD8 T cells.

