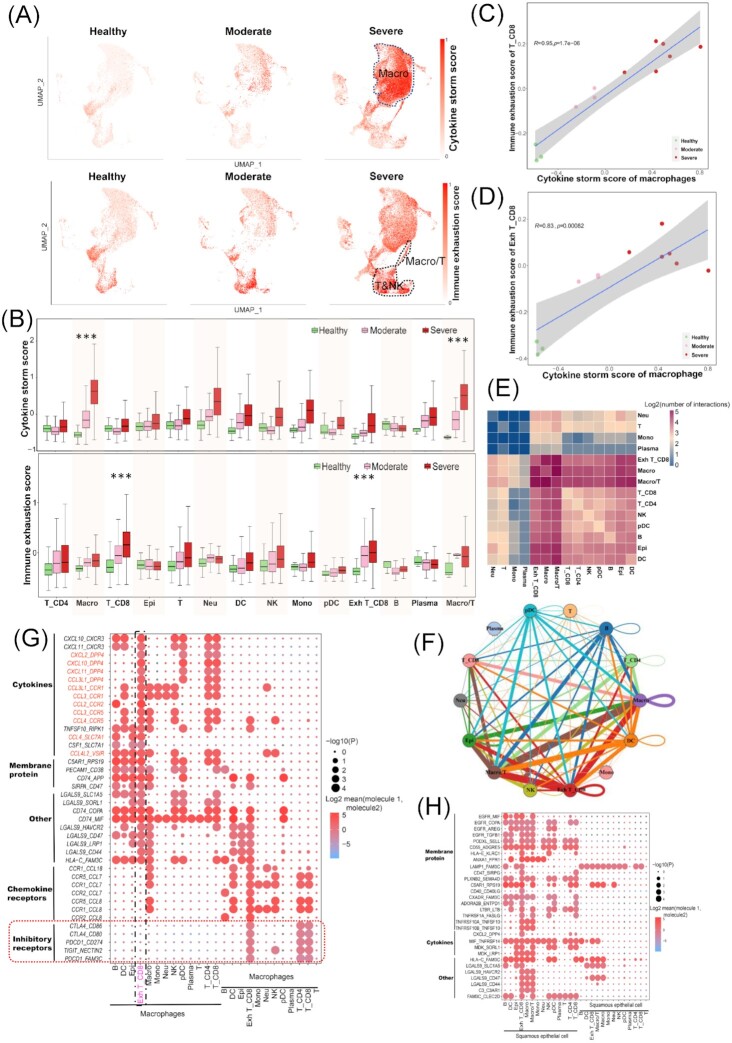
Figure 2.
Impacts of cytokine storms derived from macrophages on CD8 T cell exhaustion. (A) UMAP plots of BALF cells colored by cytokine storm (top panel) and immune exhaustion (bottom panel) scores across healthy controls (n = 3), moderate patients (n = 3), and severe patients (n = 6). The scores were scaled as 0–1. (B) Cytokine storms (top panel) and immune exhaustion (bottom panel) scores. (C and D) Pearson correlation between immune exhaustion score of CD8 T (T_CD8 and Exh T_CD8 respectively) and cytokine storm score of macrophages. (E) Heatmap shows the log2 (transformed number) of interactions between different cell types. (F) The cell–cell interaction network shows interaction frequencies between different cell types. Colorful nodes represent cell types, edges stand for cell–cell interaction, and their sizes indicate interaction numbers. (G and H) Dot plots show the selected ligand–receptor interactions mediating cell–cell communications: (G) is for macrophages and other cell types and (H) for squamous epithelial cell and other cell types. The circle size indicates P value. The means of the average expression levels of interacting molecule 1 in cluster 1 and interacting molecule 2 in cluster 2 are indicated by colour.

