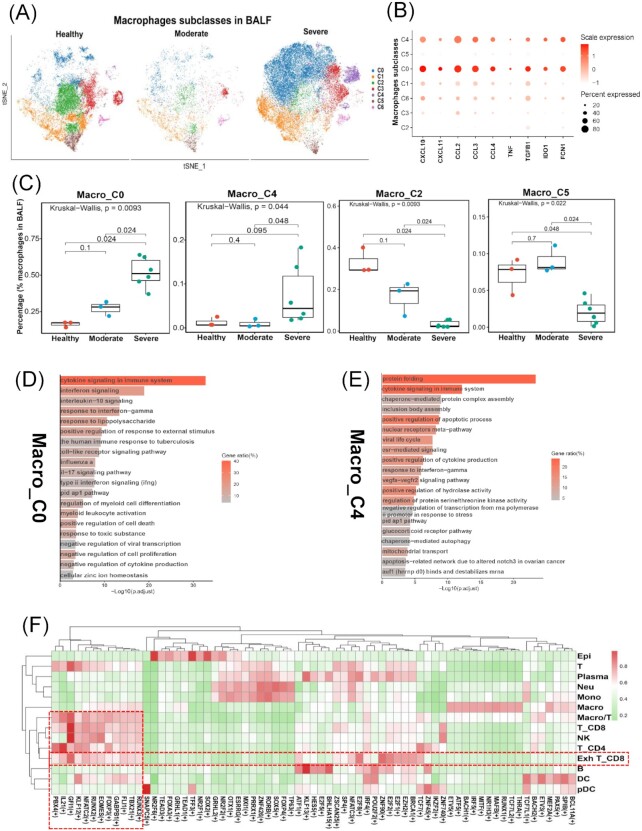
Figure 3.
Identification of macrophage subclasses related to cytokine storms. (A) tSNE map plot of the macrophages colored by heterogeneous subclasses and split into the three disease states (healthy, moderate, and severe). (B) Dot plots show the expression levels of cytokine storms-related genes across 7 macrophage subclasses. (C) Boxplots show the cell percentages of 4 macrophage subclasses across three disease states. (D and E) The top 20 enriched pathways/processes of the top 100 differently expressed genes in Macro_C0 (D) and Macro_C4 (E) (hypergeometric test, adjusted P-values obtained by the Benjamini–Hochberg procedure). (F) Heatmap shows the regulon specificity score (RSS) for transcriptional factors (columns) corresponding to cell types (rows).

