Figure 4.
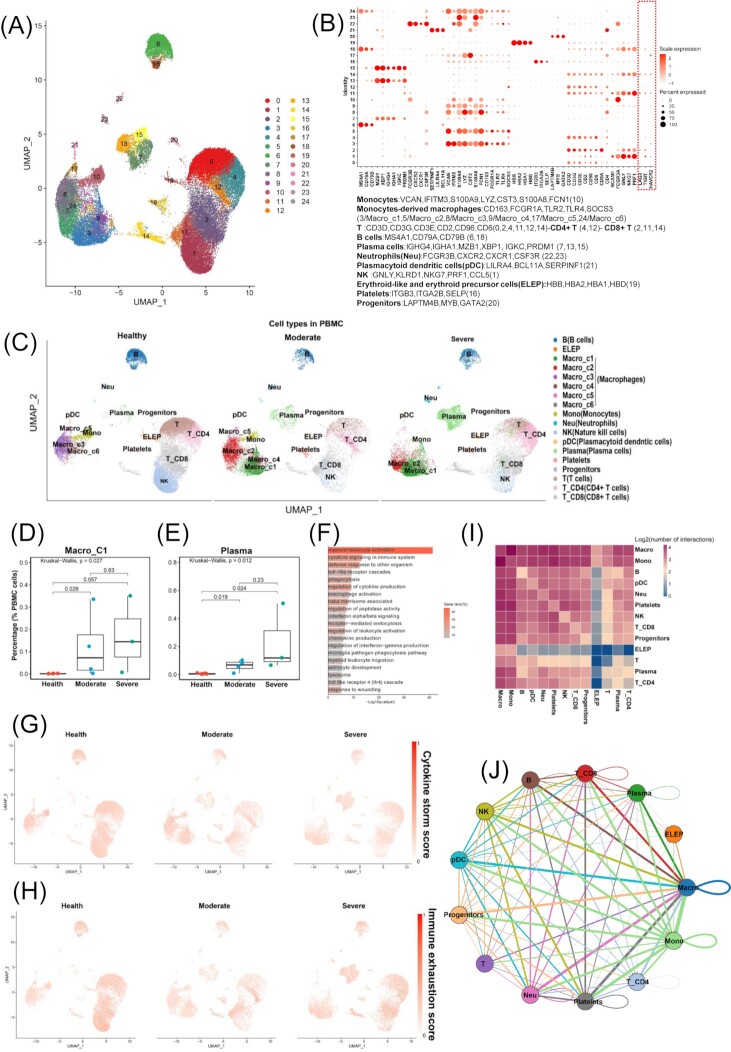
Single-cell RNA-seq analysis to investigate the impact of cytokine storms on TEX in PBMC. (A) Overview of the cell clusters in PBMCs (n = 13) derived from across healthy people (n = 6), moderate (n = 4), and severe (n = 3) COVID-19 patients. (B) Dotplots show the expression level of canonical markers representing cell types in PBMC. Cell types and their corresponding genes are listed at the bottom. (C) UMAP plots of PBMC colored by cell type among three disease states (healthy control, moderate, and severe). Cell percentage comparisons of Macro_C1 (D) and plasma (E) in PBMC across healthy controls, moderate, and severe patients. Kruskal–Wallis H test. (F) Pathway and process enrichment analysis of the top 100 highly expressed genes in a subclass of macrophages (Macro_C1). UMAP plots of PBMCs colored by cytokine storm (G) and immune exhaustion (H) scores across three disease states. The scores are scaled to 0–1. (I) Log2-transformed frequency of interactions between cell types of PBMC. (J) Cell–cell interaction network shows the interaction frequencies between cell types of PBMC.

