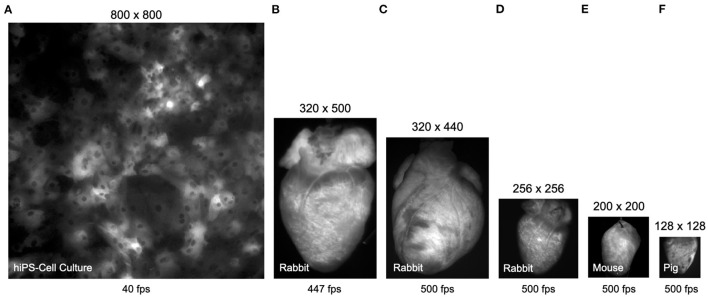
Figure 3.
Comparison (to scale) of video data obtained with different cameras in calcium- and voltage-sensitive optical mapping experiments. All hearts were stained with voltage-sensitive fluorescent dye Di-4-ANEPPS. (A) Human iPSC-derived cardiomyocyte monolayer expressing the genetically encoded calcium indicator GCaMP-X imaged at 40 fps with 800 × 800 pixel resolution (0.74mm field of view) using an IDS μEye UI-3060CP-M-GL camera (refer to Supplementary Video 6). (B) Rabbit heart imaged at 447 fps with 320 × 500 pixel resolution using an IDS μEye UI-3060CP-M-GL camera (refer to Supplementary Video 3). (C) Rabbit heart imaged at 500 fps with 320 × 440 pixel resolution using a Basler acA720-520um camera (refer to Supplementary Videos 1, 2). (D) Rabbit heart imaged at 500 fps with 256 × 256 pixel resolution using a Brainvision Scimedia MiCAM N256 camera (refer to Supplementary Video 9). (E) Mouse heart imaged at 500 fps with 200 × 200 pixel resolution (cropped from original video imaged with 720 × 320 pixels) using a Basler acA720–520 um camera (refer to Supplementary Video 4). (F) Porcine heart imaged at 500 fps with 128 × 128 pixel resolution using a Teledyne Photometrics Evolve 128 camera. The video data in (A,F) can be processed in real-time, faster than the acquisition speeds at 40 and 500 fps, respectively, using GPU-accelerated processing, refer to Figures 8, 9.

