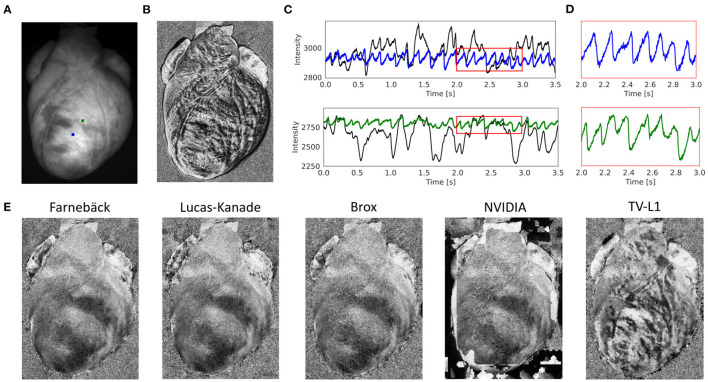
Figure 5.
Contracting rabbit heart imaged during ventricular fibrillation (VF) using voltage-sensitive optical mapping (staining with Di-4-ANEPPS). Motion artifacts were inhibited using GPU-accelerated numerical motion tracking and motion compensation. (A) Video image from original recording (500 fps, 320 × 440 pixels, Basler acA720–520 um camera). ROI (green and blue, 6 × 6 pixels) used to extract optical traces shown in (C). (B) Pixel-wise normalized (0.5 s sliding window) optical map without numerical motion tracking and motion compensation. Without motion compensation, the optical maps are dominated by motion artifacts. Action potential waves are not visible. (C) Optical traces measured from two sites shown in (A) before (black) and after (blue and green) numerical motion compensation using Farnebäck GPU-based motion tracking algorithm. Motion artifacts become significantly reduced. Traces averaged over the two rectangular regions shown in (A). (D) Close-up of motion-corrected optical traces in (C) showing a series of action potentials (downstrokes correspond to action potential upstrokes due to staining). During VF, residual illumination-related motion artifacts are small due to the minimal motion of the heart, refer to Kappadan et al. (20). (E) Motion-compensated, pixel-wise normalized optical maps derived with 5 different motion tracking algorithms (Farnebäck, Lucas-Kanade, Brox, NVIDIA, TV-L1; all GPU, sorted from left to right by robustness/accuracy) show vortex-like action potential waves (dark) on the fibrillating ventricular surface, refer to Supplementary Video 2.

