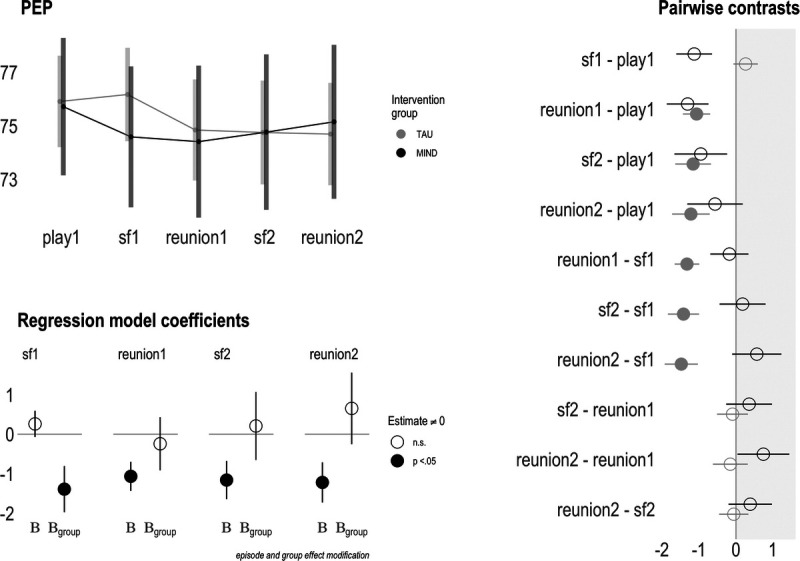
FIGURE 1.

Maternal prenatal intervention effects on sympathetic nervous system activity at 6 months of age. A, Upper left panel shows group-level PEP means across the still face paradigm. B, Bottom left panel is a pictorial representation of PEP model 2 (main effects + interaction), where “B” shows the estimates for the control group (rows 2–5 of Table 2), and “Bgroup” shows the estimates for the intervention group (rows 8–11 of Table 2). Filled-in circles represent model coefficient significantly different (p < .05) from zero. C, Rightmost panel depicts episode-level contrasts between the intervention and control groups. Filled-in circles represent model coefficient significantly different (p < .05) from zero. PEP = preejection period. Color version of this figure is available online only with this article at www.psychosomaticmedicine.org.
