
Figure 6.
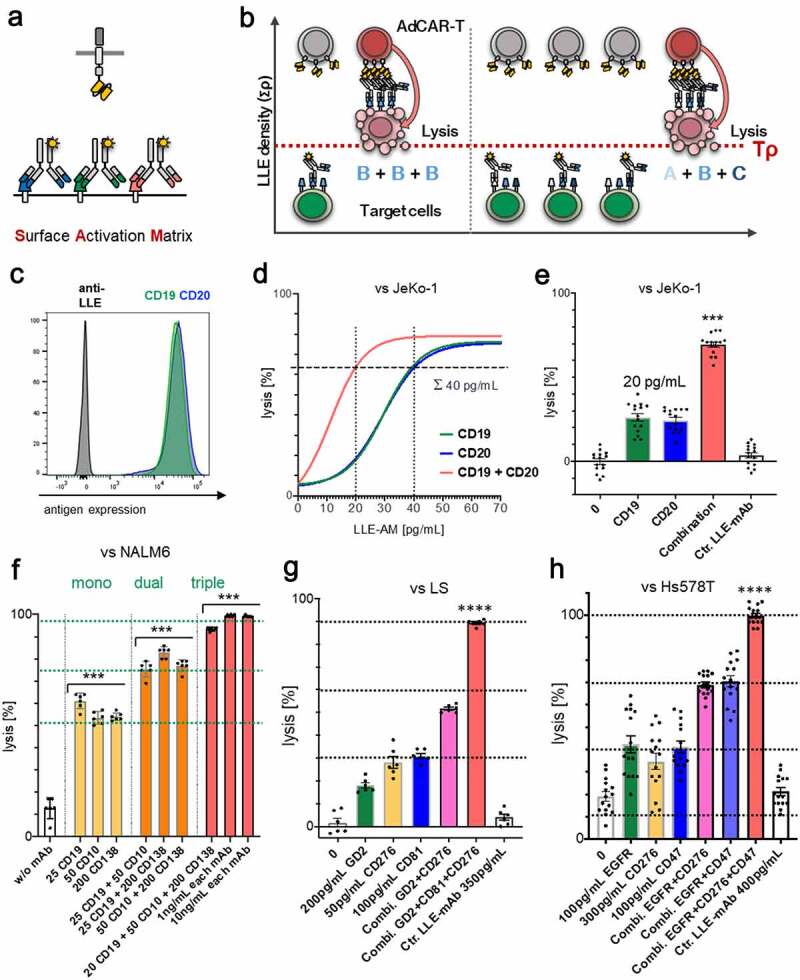
Surface Activation Matrix (SAM) a new concept of targeted polyimmunotherapy
A) Schematic illustration of the SAM effect. B) Schematic illustration of target cell identification and lysis by integration of antigen expression profiles. C) Target-antigen expression on JeKo-1 determined by flow cytometry. D-E) AdCAR-T were incubated with JeKo-1 at an E:T ratio of 2:1 for 48 h in presence of the indicated AMs at indicated concentrations or an additive combination of both. Target-cell lysis was determined by LCA. E) Specific lysis for 20 pg/mL LLE-CD19 mAb, 20 pg/mL LLE-CD20 mAb, and 20 pg/mL LLE-CD19 mAb + 20 pg/mL LLE-CD20 mAb as well as unspecific control LLE-mAb at 40 pg/mL is demonstrated. F) AdCAR-T were incubated with NALM6 at an E:T ratio of 1:1 for 24 h in presence of the indicated AMs or additive combinations thereof at indicated concentrations. Target-cell lysis was determined by LCA. G) AdCAR-T were incubated with LS at an E:T ratio of 2:1 for 48 h in presence of the indicated AMs or additive combinations thereof at indicated concentrations. Target-cell lysis was determined by LCA. H) AdCAR-T were incubated with Hs578T at an E:T ratio of 2:1 for 48 h in presence of the indicated AMs or additive combinations thereof at indicated concentrations. Target-cell lysis was determined by LCA. Data shown in D) represent mean of (n = 3) independent experiments from different donors in triplicates. Data shown in E) represent mean ± SEM of (n = 5) independent experiments from different donors in triplicates. Data shown in F) and G) represent mean ± SEM of (n = 2) independent experiments in triplicates from different donors. Data shown in H) represent mean ± SEM of (n = 5) independent experiments in triplicates from different donors. In E-H) significance was determined by one-way ANOVA and Tukey post hoc test. (LCA) luciferase cytotoxicity assay. Titration curve was calculated by nonlinear regression [log(agonist) vs. response] (n = 3). Uncalculated lysis curve for JeKo-1 is shown in (fig. S7A).