
Figure 7.
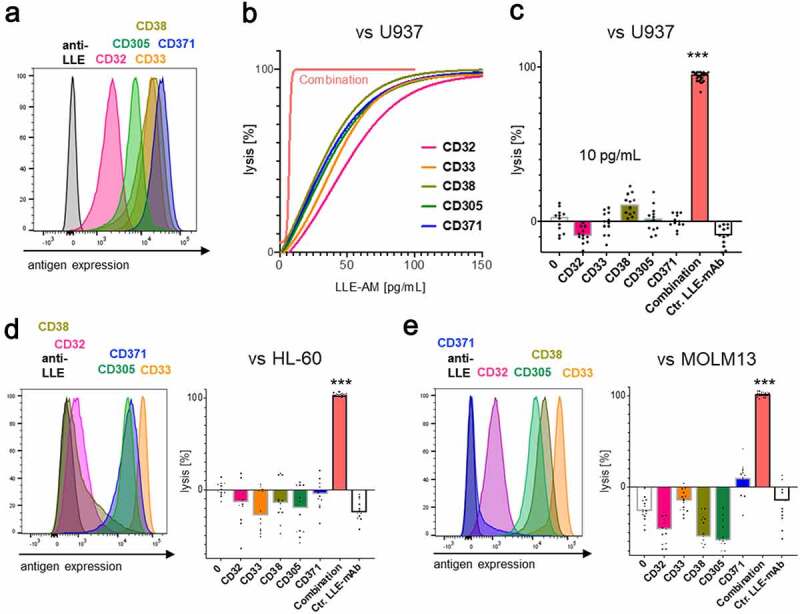
Identification and target cell lysis by integration of antigen expression profiles in AML
Target-antigen expression in three AML cell lines U937, HL60 and MOLM13 was determined by flow cytometry. The colors in the histoplot consistently encode the expression and lysis, targeting these five indicated potential CAR-T cell target antigens CD32, CD33, CD38, CD305, and CD371. Cytolysis at 48 h of indicated cell lines by AdCAR-T was determined by LCA in the presence of the indicated AMs at indicated concentrations or an additive combination of all five AMs. A) Target-antigen expression of U937. B–C) AdCAR-T versus U937 at an E:T ratio of 0.5:1. Titration curve was calculated by nonlinear regression [log(agonist) vs. response] (n = 2) from two different experiments from different donors in triplicates. Uncalculated lysis curve is shown in (fig. S7C). D–E) AdCAR-T versus HL60 or MOLM13 at an E:T ratio of 1:1. B–C) Specific lysis for 10 pg/mL of the individual AMs and the additive combination of all five, 10 pg/mL each ∑ = 50 pg/mL, as well as unspecific control LLE-mAb is shown. Data shown in B–E) represent mean of (n = 4) independent experiments and different donors in triplicates, respectively. In B–E) significance was determined by one-way ANOVA and Tukey post hoc test. (LCA) luciferase cytotoxicity assay.