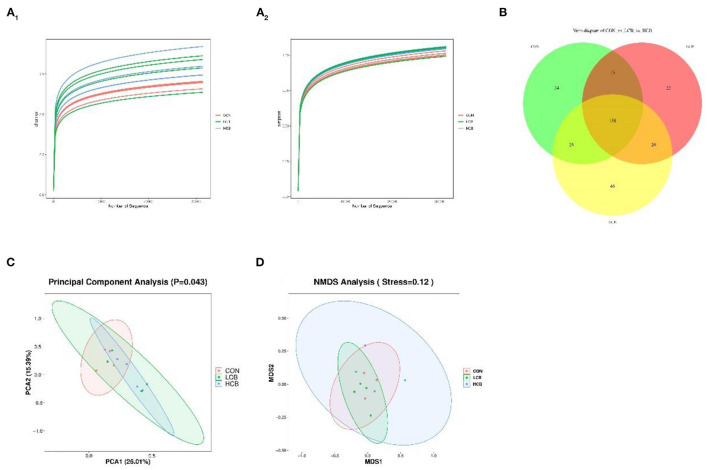
Figure 1.
The α- and β-diversity of rumen bacterial communities in fattening goats fed C. butyricum. Shannon (A1) and Simpson (A2) curves of rumen microbiome of fattening goats are shown. Unique and shared rumen feature among CON, LCB, and HCB groups (B) shown on Venn diagrams. Rumen microbial structure among the three groups was estimated by the Principal Component Analysis (C) and Nonmetric Multidimensional Scaling Analysis (D).

