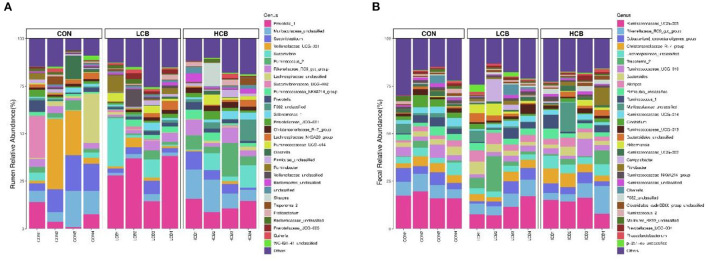
Figure 4.
Stacked bar graph displays a comparison of microbial relative abundance (%) at genus level among main effects of treatments in rumen (A) and fecal (B) of fattening goats. The label CON denotes without prebiotics, the label LCB denotes low-dose C. butyricum, and the label HCB denotes high-dose C. butyricum for each sample. The letters (1,2,3 and 4) denote replicate samples. CON: 0 CFU C. butyricum per kilogram feed, LCB: 2.0 × 10⁸ CFU C. butyricum per kilogram feed, HCB: 1.0 × 10⁹ CFU C. butyricum per kilogram feed.

