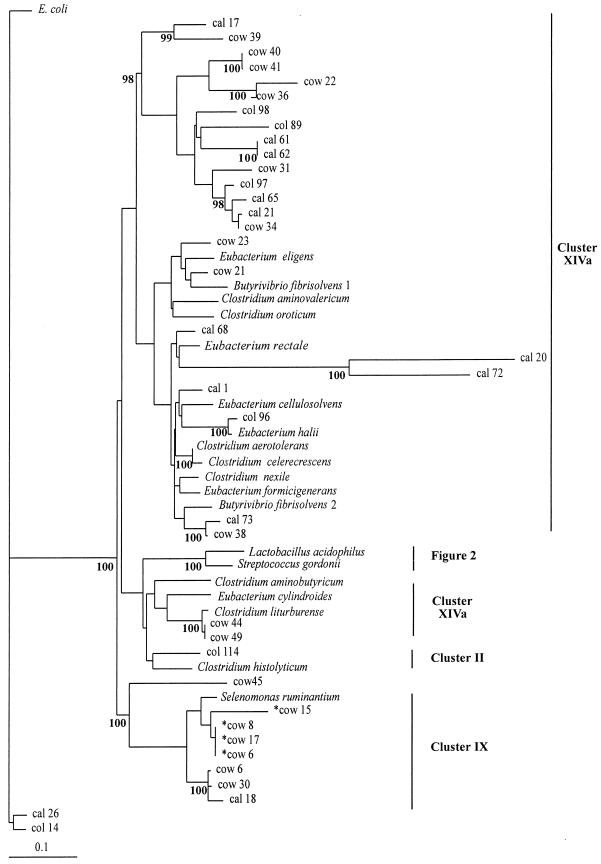
FIG. 1.
Phylogenetic tree showing 16S rDNA sequences from porcine hindgut samples for low-G+C-content bacteria. The tree was constructed by neighbor-joining analysis of a distance matrix obtained from a multiple-sequence alignment. Bootstrap values (expressed as percentages of 100 replications) are shown at branch points: values of 90% or more were considered significant. Sequences derived from the database are shown in italics. The cultured isolates from the colonic wall are prefixed by asterisks. E. coli is used as the outgroup sequence. The scale bar represents substitutions per 100 nucleotides.

