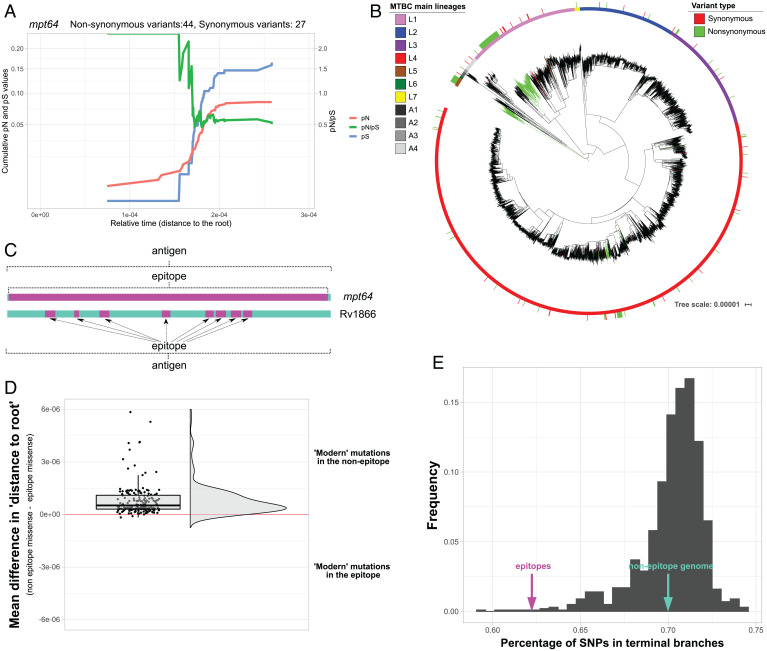
Fig. 2.
Specific antigenic genes show signs of early positive selection. (A) Cumulative pN, pS, and pN/pS trajectories over time for the mpt64 gene (Rv1980c). The x axis represents the genetic distance of each node to the root. The left y axis represents the cumulative pN (red line) and pS (blue line) values. The right y axis represents the pN/pS. (B) Maximum likelihood MTBC phylogeny with mapped mpt64 variants. The sticks in the outer circle mark the strains with variants identified (red, synonymous; green, nonsynonymous). Deep nonsynonymous mutations can be found in deep nodes of L1 and L5. (C) Some epitopes comprise the entire antigen (such as in mpt64), while in genes such as Rv1866, the epitope represents a small subset of regions embedded in the antigen. (D) Rain cloud plot of the mean differences in the distance (to root) value between the nonepitope and the epitope mutations for each antigen. (E) Distribution of SNPs found in terminal branches for 1,000 randomly selected sets of nonepitope fragments (gray bars). The percentage of SNPs observed in the epitopes differs from this distribution (∼62%, z score = −4,28; pink arrow), while the percentage of SNPs found in the rest of the genome remains similar to the distribution (∼70%; green arrow).

