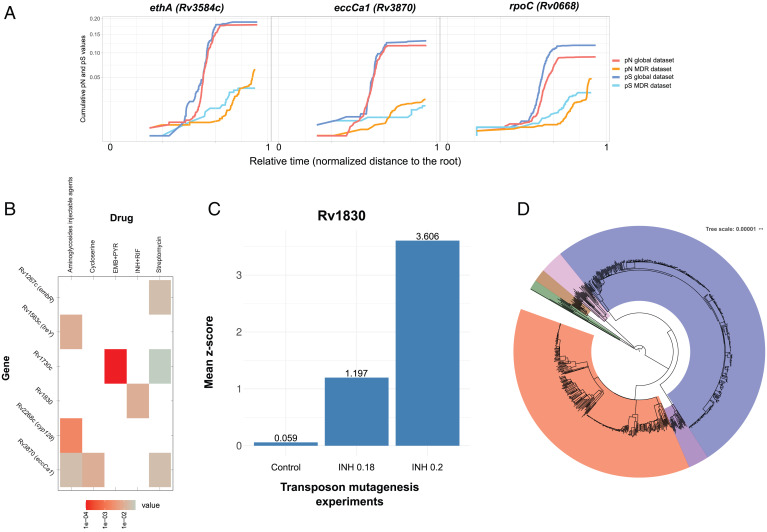
Fig. 3.
Identification of genes related to second-line antibiotic resistance. (A) Three genes showing signs of ongoing positive selection in the MDR-enriched dataset but ongoing purifying selection in the global dataset. The x axis represents the node to root genetic distance normalized in the zero to one range to merge data from both trees as a measure of relative time. The y axis represents the cumulative dN and dS values. (B) A computational model has been constructed for each antituberculosis drug to identify specific gene mutations associated with resistance. In the matrix, rows represent antibiotics, and columns represent genes suspected to be under positive selection in the MDR-enriched dataset. Colored cells (from gray to red) indicate a statistically significant association between nonsynonymous mutations found in the genes and resistant phenotypes. In this figure, only the less well–studied genes are shown. SI Appendix, Fig. S4 has the complete results. (C) Transposon sequencing (TN-seq) experiments have been performed (x axis) in the absence of isoniazid (control) and in two different isoniazid concentrations: 0.18 and 0.2 μg/mL. We observe a higher number of transposon insertions in Rv1830 compared with the mean number of insertions in the rest of the genome (calculated as a z score; y axis) in INH-treated experiments vs. control. This result provides in vitro evidence of how Rv1830 is a genetic determinant for isoniazid resistance. (D) Maximum likelihood phylogeny constructed with the MDR-enriched dataset showing an overrepresentation of L2 (blue) and L4 (red) strains. EMB, ethambutol; INH, isoniazid; PYR, pyrazinamide; RIF, rifampicin.

