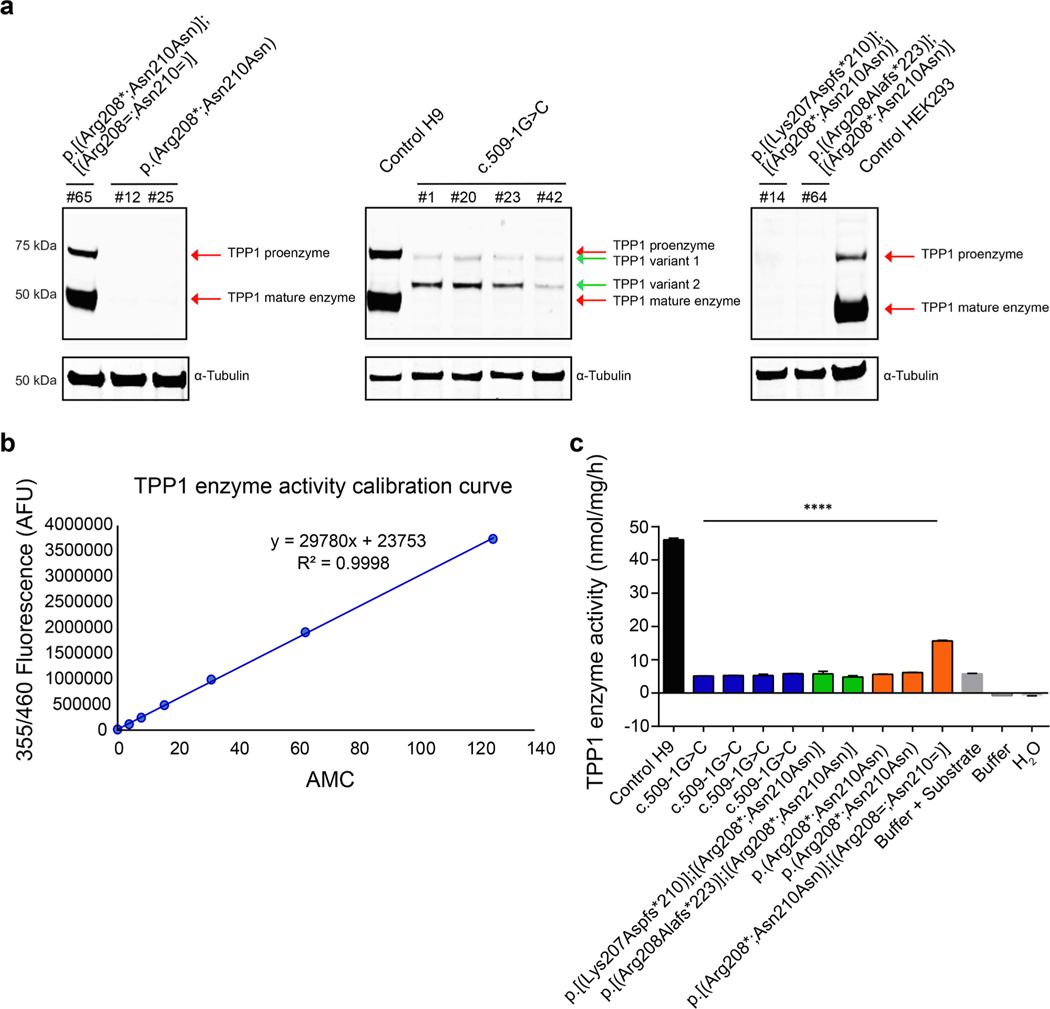
Fig. 2.
Analysis of protein expression and TPP1 enzyme activity in control H9 hESCs and TPP1-mutant hESCs. (a) Western blot of lysates from control cells (H9 hESCs and HEK293 cells) and TPP1-mutant hESCs of the indicated genotypes using antibodies against TPP1 and α-Tubulin (as a loading control). Lysates from HEK293 cells were used as a non-stem cell line control. Note, the Western blot was run as a single gel; however, it has been separated into three sections so as to be able to more clearly indicate the different TPP1 bands (red and green arrows). (b) Calibration curve used for calculating TPP1 enzyme activity. The curve was generated by determining the fluorescence intensity of emission at 460 nm, graphed as arbitrary fluorescence units (AFU), for different amounts of AMC (0, 3.9, 7.8, 15.625, 31.25, 62.5 and 125 nmol). (c) TPP1 enzyme activity in lysates from control H9 hESCs and from TPP1-mutant hESCs of the indicated genotypes, as determined by AMC production. Buffer with or without substrate and H2O were used as controls. Lysates from cells or buffer were incubated with AAF-AMC at 37 °C for 20 h; enzyme activity was normalized to total protein and is represented as nmol/mg/h. n = 3 replicates. Data are presented as means ± SEMs. Unpaired Student’s t tests were used. Significance reflects differences in TPP1 enzyme activity in control H9 hESCs vs. TPP1-mutant hESCs. **** p < 0.0001.

