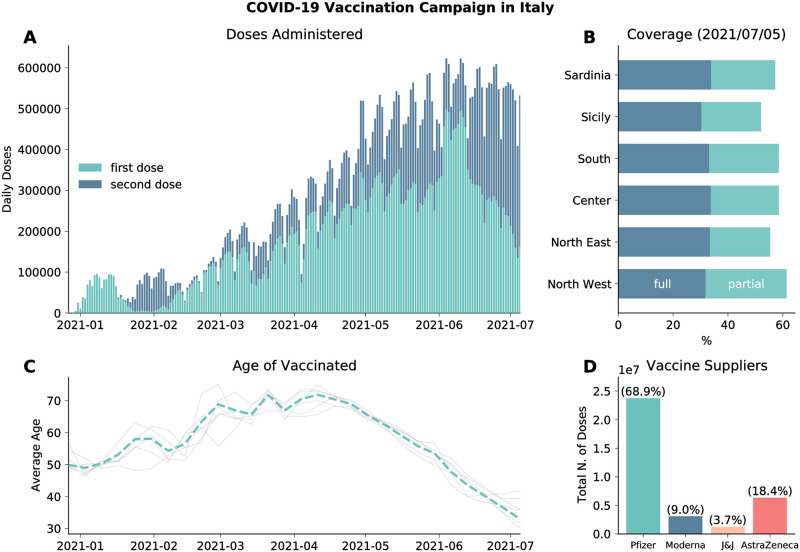
Fig 1. Vaccination campaign in Italy.
A) Number of daily first and second administered daily in the country. B) Percentage of total population vaccinated with one/two dose in different regions considered. C) Average age of those who received the first dose of vaccines (dashed line). Grey lines indicate the average age of vaccinated in different regions considered. D) Total number of first doses administered between 2020/12/27 and 2021/07/05 by vaccine supplier.

