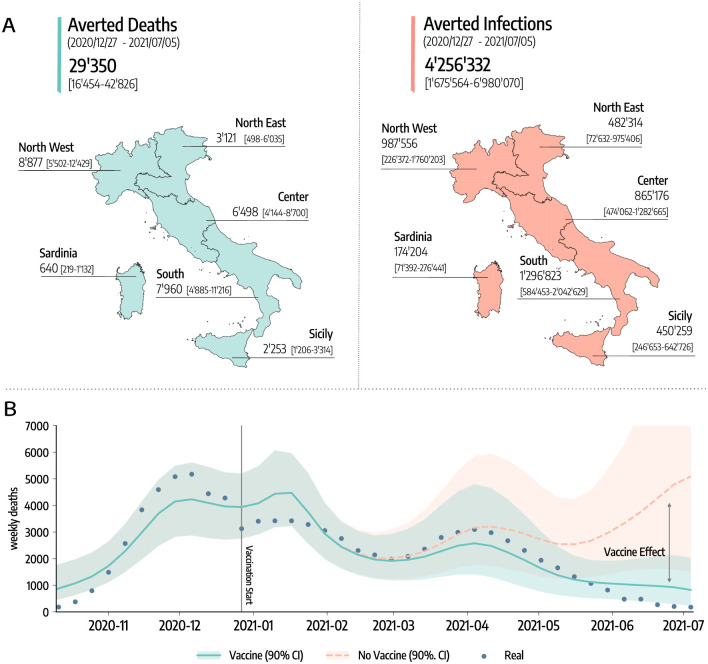
Fig 3. Averted deaths and infections.
A) Estimated averted deaths and infections in different regions considered with respect to a baseline without vaccines. Median and interquartile (IQR) range are reported. The base layer for the map is available in the Database of Global Administrative Areas and can be downloaded from https://gadm.org/download_country.html. B) Number of weekly deaths at the country level as reported by official surveillance and as estimated by our model with and without vaccines rollout (median and 90% confidence intervals displayed).

