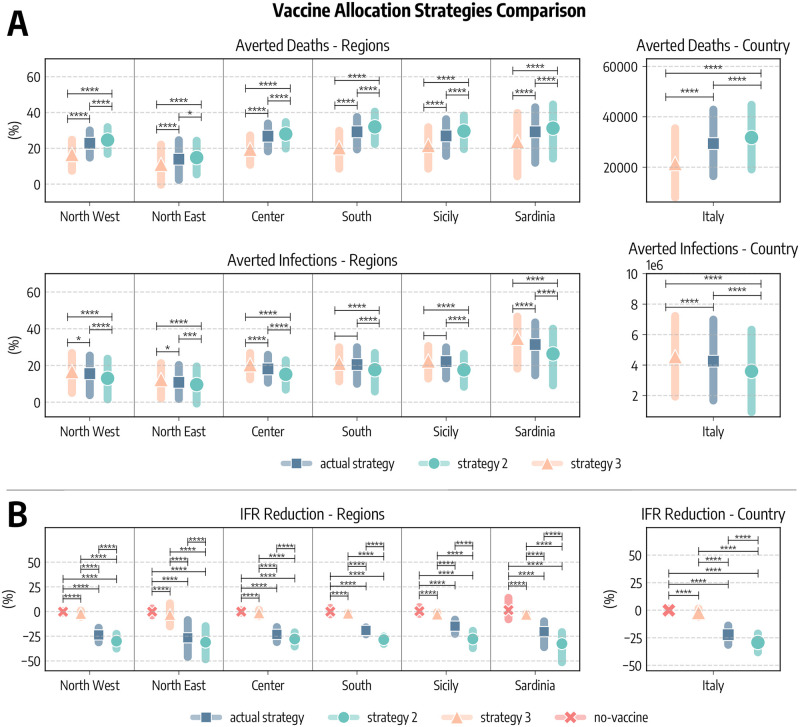
Fig 4. Comparison of vaccine allocation strategies.
A) Averted COVID-19 deaths and infections, both at subnational and national level (medians and interquartile ranges are reported). B) Percentage reduction of the Infection Fatality Rate as of 2021/07/05. In all panels, actual strategy denotes an allocation strategy that follows the observed allocation as it unfolded during the pandemic, strategy 2 considers the case where vaccines are allocated in decreasing age order starting from the 80+, strategy 3 considers the case in which vaccines are first allocated to the age groups 20–49 and then homogeneously to the rest of the population, and no-vaccine denotes the counterfactual scenario in which vaccines were not administered. In both panel we report the statistical significance of the Kruskal-Wallis H-test comparing different scenarios as follows: ****: pvalue ≤ 10−4, ***: 10−4 < pvalue ≤ 10−3, **: 10−3 < pvalue ≤ 10−2, *: 10−2 < pvalue ≤ 0.05, and otherwise blank if pvalue > 0.05.

