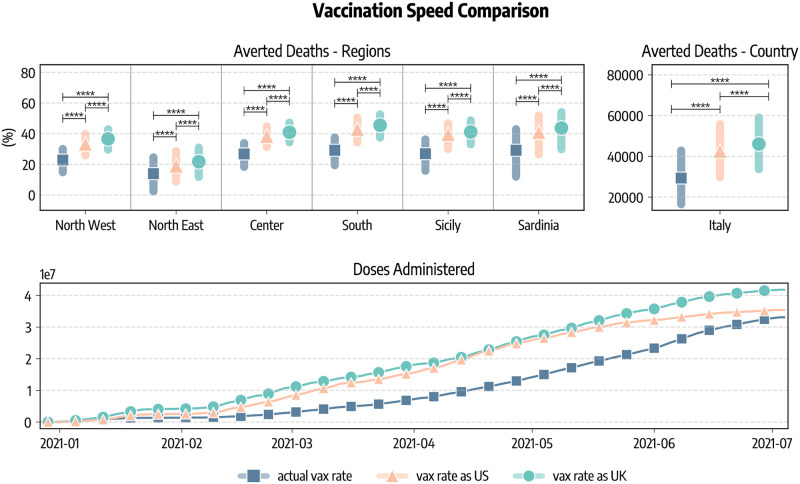
Fig 5. Comparison of vaccination speeds and doses.
We show the percentage of deaths averted with respect to simulations without vaccines in different regions considering the real data-driven campaign, and rescaling the number of doses to match those administered in the United Kingdom and the United States. We also report the estimated total number of deaths (median and IQR) averted in Italy as well as the number of cumulative doses administered in the scenarios. The figure also shows the statistical significance of the Kruskal-Wallis H-test comparing different scenarios as follows: ****: pvalue ≤ 10−4, ***: 10−4 < pvalue ≤ 10−3, **: 10−3 < pvalue ≤ 10−2, *: 10−2 < pvalue ≤ 0.05, and otherwise blank if pvalue > 0.05.

