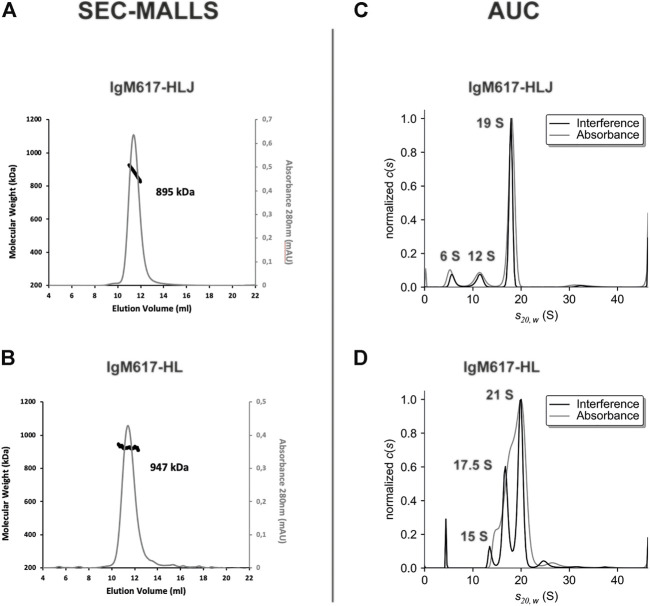
FIGURE 2.
Size exclusion chromatography coupled to multi-angle laser light scattering (SEC-MALLS) and analytical ultracentrifugation (AUC) analysis of purified IgM617 samples from HEK293F expression. The left panels show the elution profiles of the purified (A) IgM617-HLJ and (B) IgM617-HL monitored by the excess refractive index (right ordinate axis) and the molecular weight as bold line (left ordinate axis) derived from MALLS, refractometry, and UV-Vis measurements. The estimated average molecular weights are indicated on the graphs. The right panels show the sedimentation distributions of (C) purified IgM617-HLJ and (D) IgM617-HL. Calculated and corrected sedimentation coefficients S 20,W are obtained as described in Materials and Methods and are indicated on the graphs.

