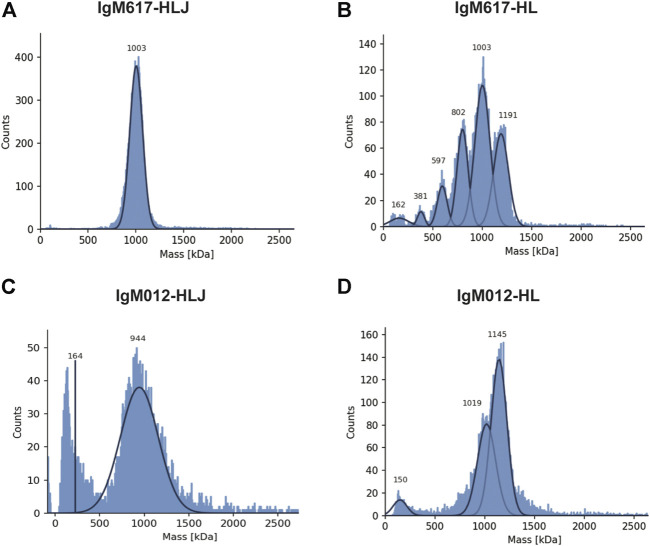
FIGURE 3.
Mass photometry (MP) analysis of recombinant IgMs produced in HEK293F. Histograms show the population distributions of purified IgMs. Shown analyses are representative of replicate experiments: (A) IgM617-HLJ, (B) IgM617-HL, (C) IgM012-HLJ, and (D) IgM012-HL. Estimated molecular weights for the shown experiments are indicated on each graph.

