
Fig. 5. Chick ex ovo culture and CAM assay for investigating the vascularization in cryobioprinted scaffolds.
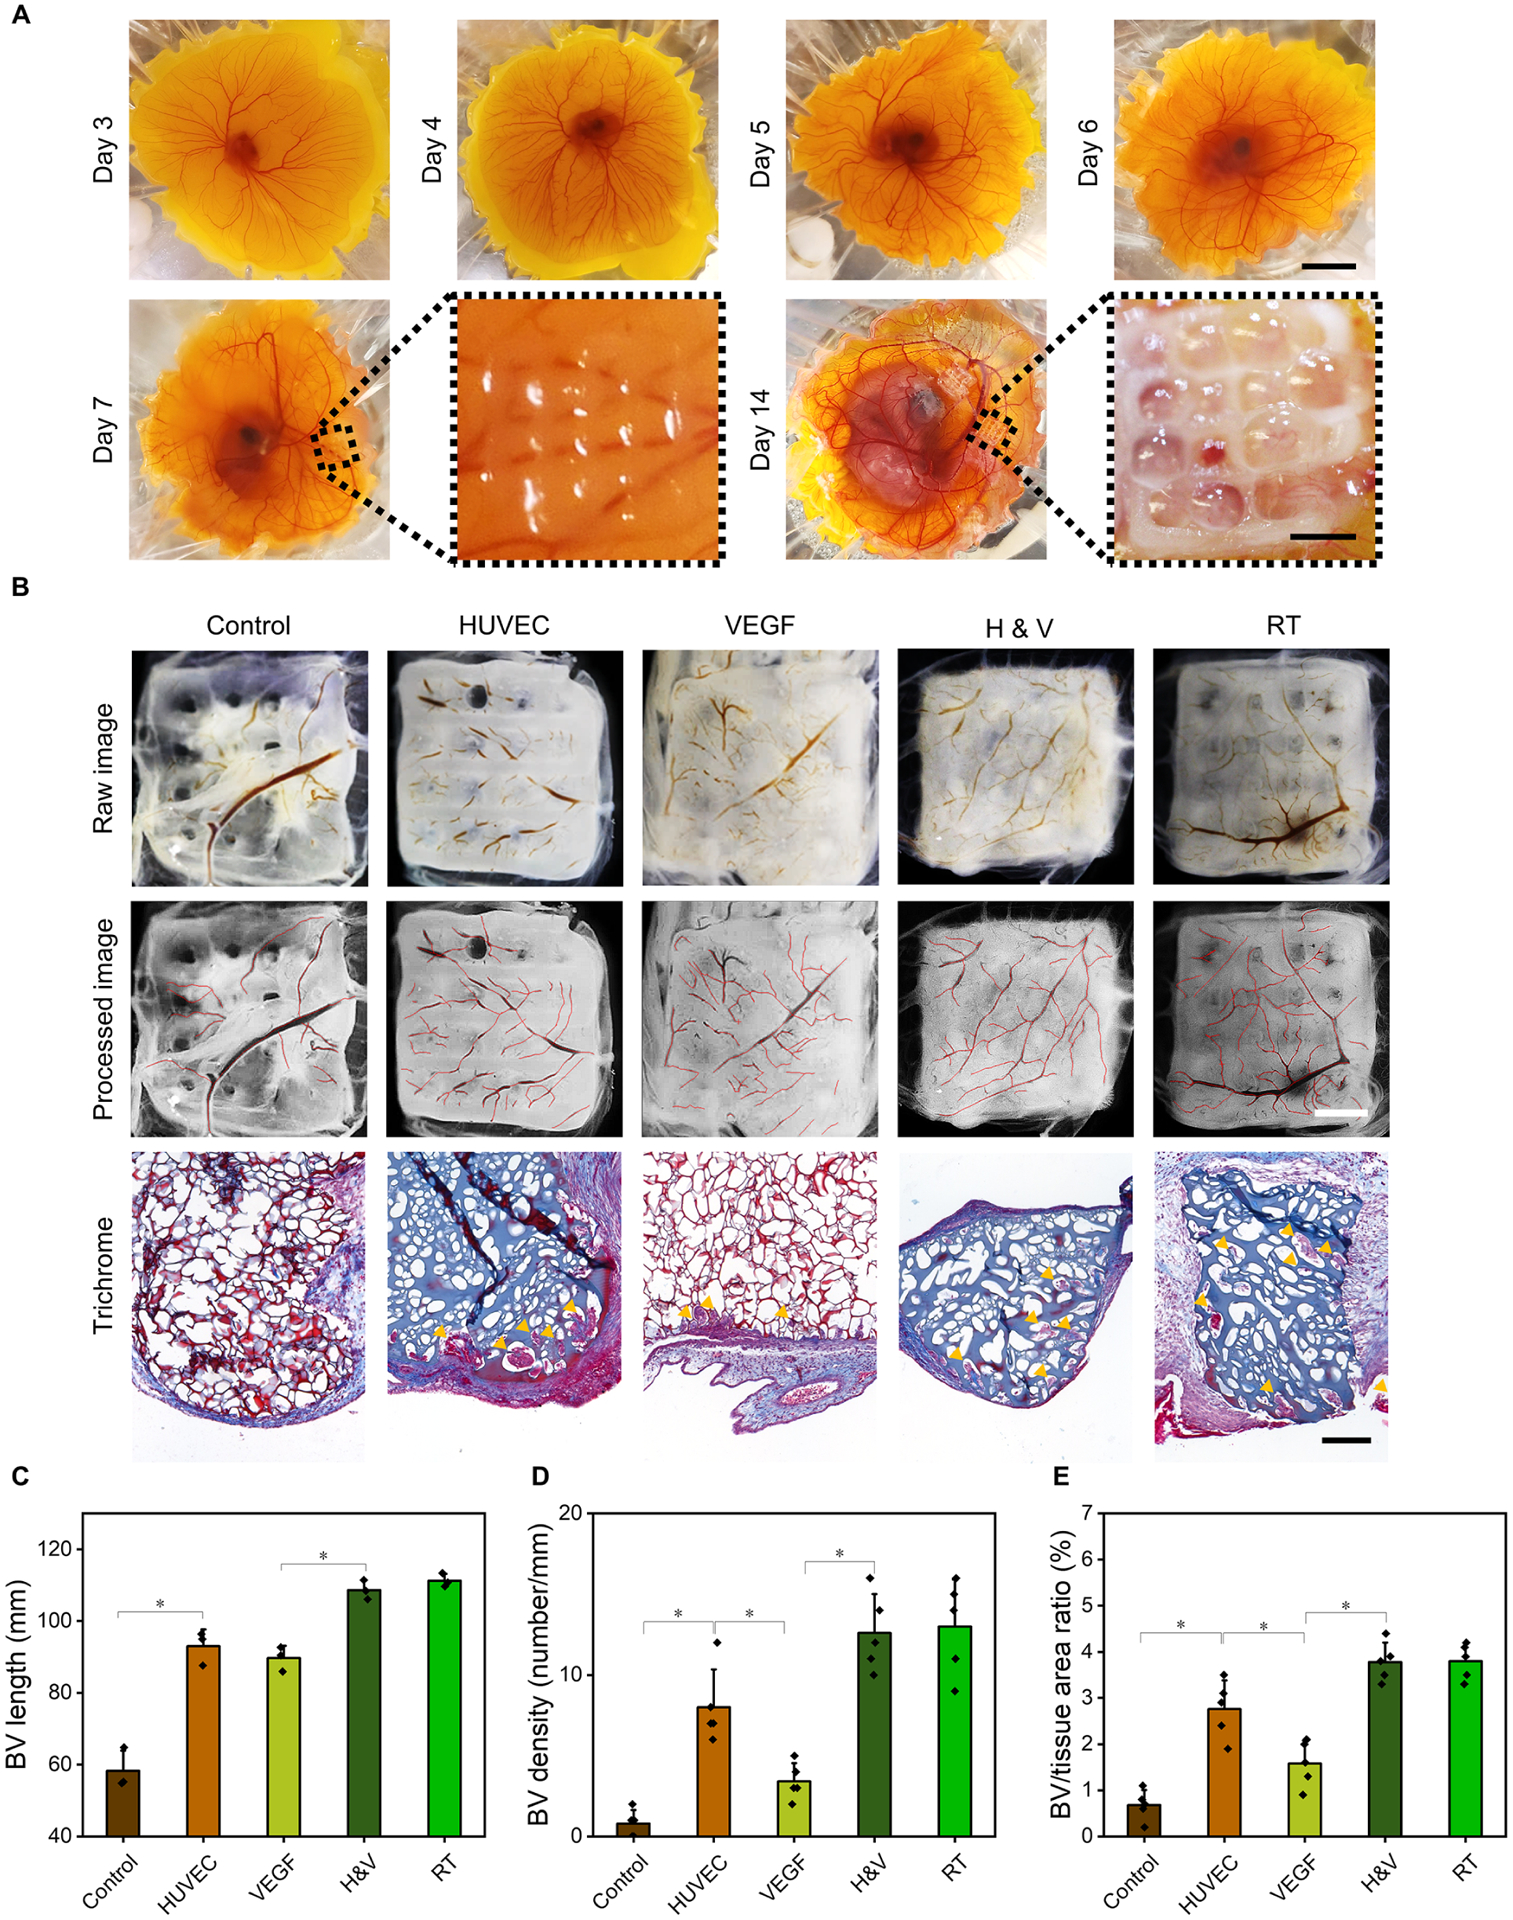
(A), Representative images of chick ex ovo culture with implanted cryobioprinted scaffolds for CAM assay in different timesteps. Scale bars: 2 cm for the low-magnification images and 2 mm for the high-magnification images. (B), Angiogenic abilities of the scaffolds and Goldner’s trichrome staining showing erythrocytes in red and collagen in green, where the blood vessels are indicated by yellow arrowheads (control: GelMA+CPA, HUVEC: GelMA+CPA+HUVECs, VEGF: GelMA+CPA+VEGF, H&V: GelMA+CPA+HUVECs+VEGF, and RT: GelMA+CPA+HUVECs+VEGF bioprinted at RT). Scale bars: 2 mm for optical images and 200 μm for histology images. (C to E), Quantification of the BV growth surrounding and within the cryobioprinted constructs by measuring different parameters: (C), lengths of the BVs surrounding the scaffolds, (D), BV densities, and (E), the ratio of BV-to-tissue areas within the scaffolds. n = 5; *P < 0.05.