FIGURE 2.
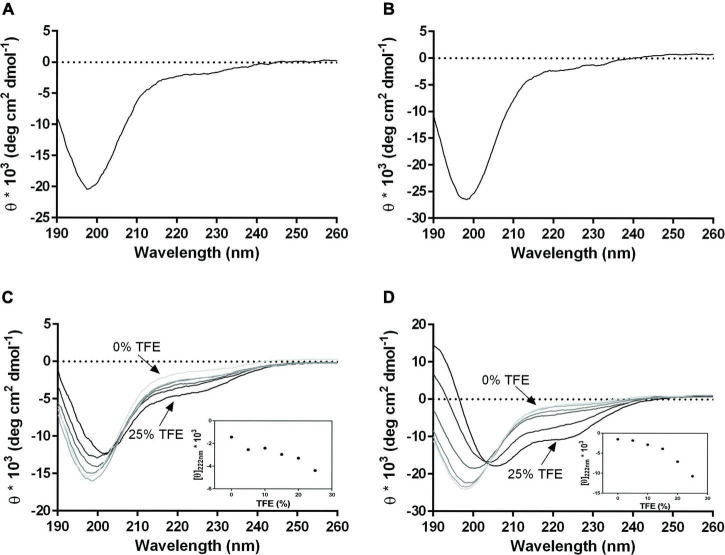
CD spectra of PS1-70 and PS1-120 and TFE titration. Far-UV CD spectra of (A) PS1-70 and (B) PS1-120. CD spectra overlapping of (C) PS1-70 and (D) PS1-120 recorded at increasing concentrations of TFE (0, 5, 10, 15 20, and 25%). Changes in molar ellipticity at 222 nm, as a function of TFE percentage are shown in the inset for both fragments. Spectra were acquired at 20°C in 10 mM phosphate buffer, pH 7.4.

