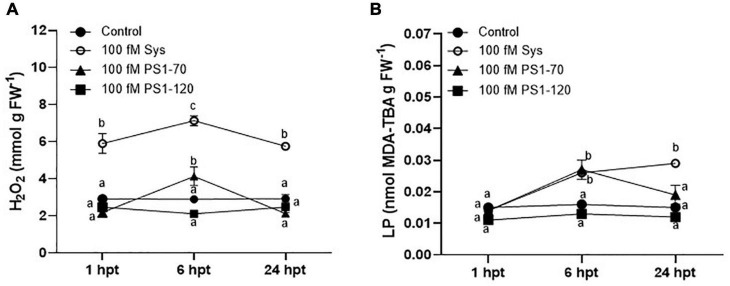
FIGURE 5.
H2O2 and MDA content in tomato leaves treated with 100 fM ProSys fragments. H2O2. (A) and MDA, (B) contents were measured in control (PBS1X) and in treated leaves at 1, 6, and 24 hpt with 100 fM Sys, PS1-70 and PS1-120. Different letters indicate statistically significant differences (One-Way ANOVA, P < 0.05). Error bars indicate standard error.

