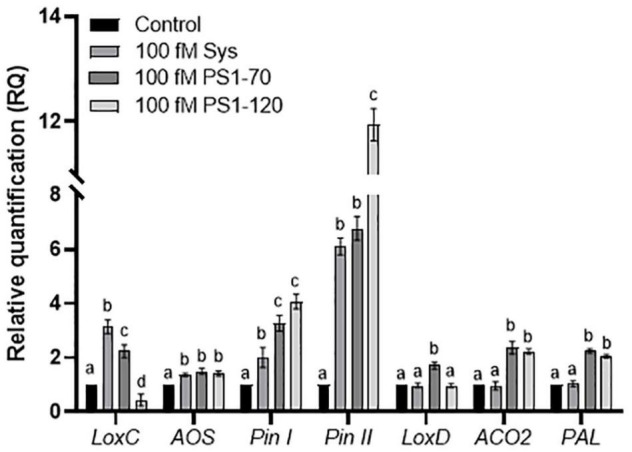
FIGURE 6.

Expression analysis of defense related genes by RT-PCR. Relative quantification of early and late defense genes induced at 6 h post treatment with 100 fM of Sys, PS1-70 and PS1-120. Quantities are shown relative to the calibrator control condition, set as 1 (mock-treated plants). Letters indicate different statistical groups (One-Way ANOVA, P < 0.05). Error bars indicate standard error.
