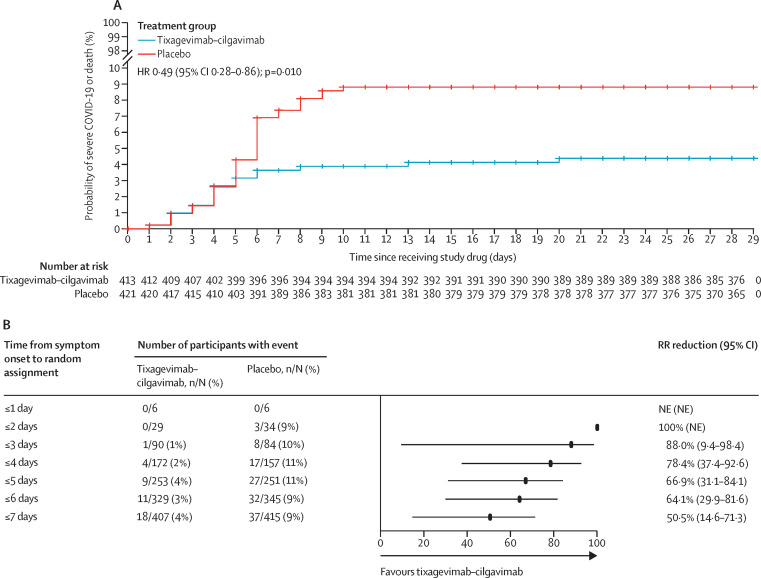
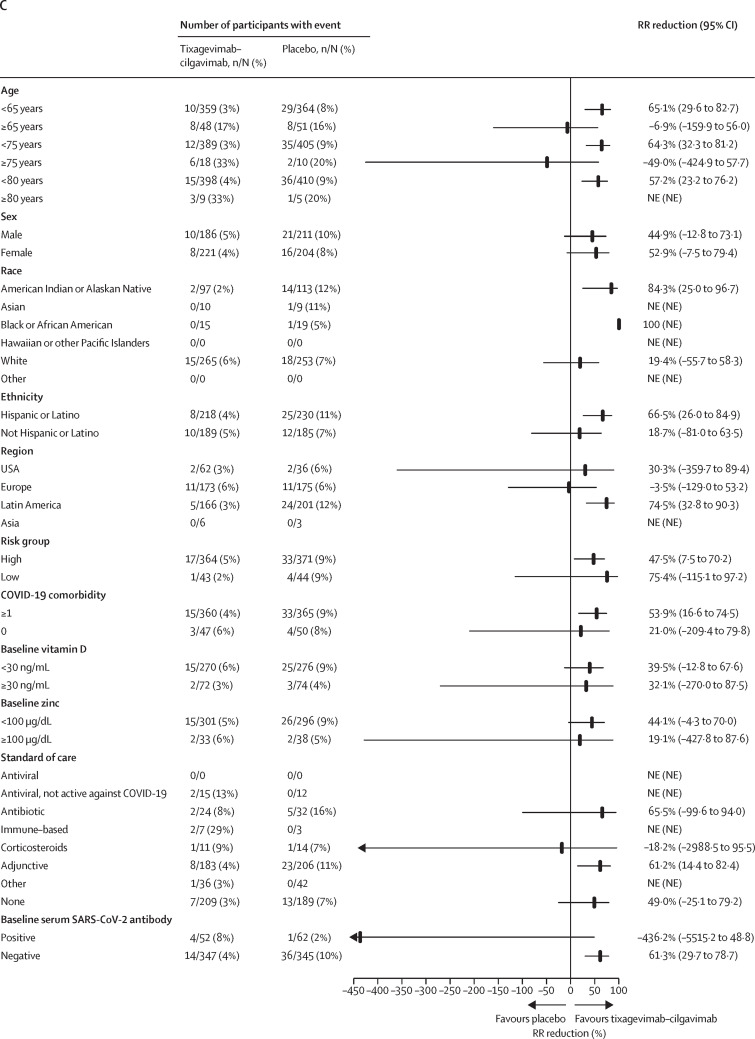
Figure 2.
Analysis of the composite primary endpoint of severe COVID-19 or death from any cause up to day 29 after receiving study drug
(A) Kaplan-Meier plot of time to severe COVID-19 or death from any cause through to day 29 in the modified full analysis set. p value is based on log-rank test stratified by time from symptom onset (≤5 days vs >5 days), when applicable, and risk of progression to severe COVID-19 (high risk vs low risk). Total number of patients censored: tixagevimab–cilgavimab group n=389, placebo group n=378. (B) Forest plot of RR reduction estimates for severe COVID-19 or death from any cause through to day 29 by time from symptom onset at random assignment. Day 1 symptom count started from the first day of symptoms. RR reductions represent the percentage reduction in incidence of severe COVID-19 or death from any cause in the tixagevimab–cilgavimab group relative to placebo. A RR reduction >0 represents favourable efficacy in the tixagevimab–cilgavimab group. (C) Forest plot of RR reduction estimates for severe COVID-19 or death from any cause through to day 29 by participant subgroup in the modified full analysis set. Arrows denote 95% CI bounds that are lower than the scale shown. Results in panel C were from a Cochran-Mantel-Haenszel test with stratification factors used in the primary analysis. For the subgroups of age, risk of progression was not a stratification factor. If there was no stratification factor, a χ2 test was used. HR=hazard ratio. NE=not evaluable. RR=relative risk.


